You may not realize it, but the everyday technologies which we have come to rely on use predictive analytics. For example, your car’s navigation system uses predictive analytics when planning the fastest route to your destination. Your smartphone weather app uses a similar method to predict if it’s going to rain tomorrow or not.
These days data science, and more specifically machine learning methods, dominate prediction systems and methods. Researchers are applying these systems and methods, specifically algorithms, across a wide range of everyday situations.
In particular, the business world benefits from predictive analytics. Having an accurate and effective forecast can reduce overhead and increase operational stability. Advantages of successful forecasting include:
- Foreseeing expected fluctuations in cash flow in order to prepare for it in advance
- Predicting future orders to keep your stock at optimum levels
- Realizing the potential loss of a customer and remedying or preventing the loss
Although the science of predictive analytics is quite new, its popularity is spreading like wildfire. That’s because it has real-world impact on businesses and their bottom lines.
Businesses already utilizing predictive analytics include:
- Online marketing
- Social media
- Fraud and error forecasting
- Preparing financial decisions
- Stock market and Forex
- Risk analysis
- HR
- Inventory planning
Managing Data
More and more companies are storing and managing their data in digital form. At the same time, the amount of data stored on the Internet and social media is increasing by the minute. A steadily increasing number of smart devices are also connecting to the Internet and databases in order to record various information.
The amount of data available is exponentially increasing. And so is its value. Data contains regularities or trends, which can predict the future fairly accurately. Therefore, in the era of big data, predictive analytics is becoming more effective in practice and valuable to companies and institutions alike.
This increase in data also contributes to the development of new science in mathematical methods that help predictive analysis, but don’t worry, we won’t dive into that here.
Business Intelligence
The primary goal of business intelligence systems is to retrieve information from data. Many BI systems use different methods of predictive analytics in order to utilize the retrieved information.
It’s easy to imagine scenarios where inaccurate forecasting can create huge problems. Let’s just think about a wedding or business event planned outdoors because of a sunny forecast only to be drenched by a sudden thunderstorm. One can imagine the chaos that could ensue from a far-off prediction in business forecasting. A different type of thunderstorm indeed.
In conclusion, it’s extremely important to be aware of the methods different business intelligence software solutions use for predictive analytics, and to find the best fit for your data to predict your future.
Data Analysis
Before going into predictive analytics in more depth, familiarize yourself with the fundamentals of data-analysis concepts.
Processing data primarily based on mathematics, more specifically on statistics, is unavoidable. This is despite that even today computers have taken control over data processing and data analysing.
You might have heard of hypothesis testing, which is the main element in statistical methods. In these cases we make an assumption about something and then run a test to confirm our hypothesis. The scientific method if you will. This is a kind of objective, which is crucial for analyzing your own data too.
You need to ask yourself: What do I want to know? What do I need to know?
For example, which one of my products generates the highest profit margin? Are our sales seasonal? Which employees work the most and who creates the most value?
Furthermore you should determine what you want to observe and how you want to measure it. Presumably you and your co-workers know your own processes the best; hence you have to come up with the answers. Experienced consultants can help you collect data for this. The next step is cleaning the data, which means filtering out recurring, erroneous, or invalid data. Filtering clarifies what data is ‘Quality Data’.
Once these fundamental steps are covered, in comes data analysis, the real ‘hunting ground’ of business intelligence systems. Every BI system visualizes data in order for you to perform a thorough analysis. They do this by displaying it in colorful charts leading to quicker understanding and decisions.
The other way to analyse data is with explanatory data analysis. This is when data analysis tools let you dig deep down into the data and discover connections. For example, a ‘drill down’ feature or a pivot table.
Perhaps the most interesting data analysis method is descriptive statistics. This method is intended to describe the characteristics or features of the studied data. Examples of characteristics are whether or not the data is increasing or decreasing, homogeneity or diversity, or revenue. Descriptive statistics are well-known measures of central tendency or deviation like average, standard deviation, median, and variance. These measures can be found both visually and numerically.
These statistical features calculated from the observed data can be generalized or applied to the entire mass of data. This means it can also be applied to the data collected in the future. This method leads us to predictive analytics.
Predictive Analytics
Predictive analytics is born from descriptive analytics. Descriptive analysis is capable of showing us whether a time series is characterized by an increasing or decreasing trend. If the measured data increased every day for the past two years then we can almost certainly say that next Monday it will still be increasing.
Predictive analysis is much more complicated than this in most cases because the descriptive analysis cannot always find principles in the studied data sets. Despite this, predictions still need to be made. In these cases algorithms are used. Algorithms involve a multi-step process that results in a desired result.
The general method used in predictive analysis is separating a significant amount of data, usually 80%, and teaching the algorithm to use this set. The remaining data, usually 20%, is used to test out the efficiency of the algorithm. Since these algorithms learn the features of the dataset during the process, we call them learning algorithms or in the IT world, machine learning. This is what people most commonly refer to as artificial intelligence or AI.
But machine learning or data science isn’t the same as artificial intelligence (AI). Machine learning is about creating and training models. Whereas AI is about using those models to infer conclusions under certain conditions. AI is part of the application level.
Traditional BI tools have strong analytical features, but they utilize machine learning techniques poorly. Insights provided by machine learning and classical analytics are different. Learning algorithms need much more data, they need training on a part of data, and they are improving over time using their learning ability.
Until recently, organizations that wanted to harness the power of predictive analytics hired data scientists, or set up a department for this, who coded in Python, R program-language, or another toolkit with necessary analytic tools. However, if you read on you’ll see that business intelligence systems are improving at such a rate that you don’t need your own scientist to predict the future with your own business data.
Predictive Analytical Methods
This section gives a general overview of the methods used by business intelligence systems currently on the market and how easy it is to use them. Ease of use is obviously an extremely important feature, because the definition of self-service BIs has been a central question for some time now. Unfortunately, when it comes to self service systems, developers have mostly failed when complex predictive analysis needs to be conducted.
With the self service issue in my mind, you can decide which methods are the most efficient for analysing your business data from the examples below. Determine which BI tool your organization has enough capacity and understanding for. In other words, see what you can put into practice with a relatively small amount of TCO.
In each section below are examples of tools for these methods. Understand that most BI systems only support the first level of predictive analysis, so we decided to include machine learning tools for those interested in trying more complex methods.
1. Trendline or regression
Tableau is the simplest and therefore most widespread predictive tool available in the wide range of business intelligence software. MS Excel is also an alternative tool for determining trendlines or regressions.
If you graphically plot your data or illustrate it, for example a time series, you can also draw the trend line manually, as the following graph shows in Tableau’s BI system.
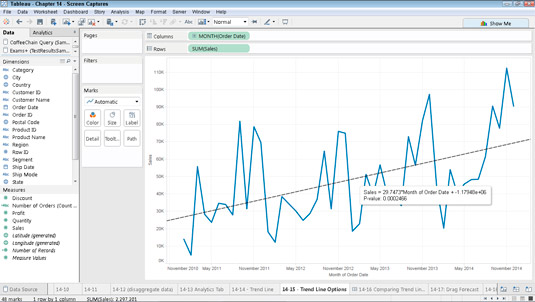
The trendline function is easy to use. As the data is given, the software creates the alignment with one click. For most systems the type of regression used should be specified. You need to have basic knowledge of statistics, although this knowledge can also be acquired through experience.
In the case of linear regression, we are trying to fit a straight line on the graph, as shown on Tableau’s example. It’s also clear that this is not the best fit. Therefore, in practice, when our data is not the output of a continuous function and separated (discrete variables), we use logistic regression, where the outputs are probability values. With this we get the probability of an event occurring. In the case of regression, it’s enough for most of us to simply remember this: we fit curves into data sets and this area of statistics is very rich.
If it’s getting too technical here for nonmathematician readers, learn more about logistic regression. For more complicated regression techniques (Probit, Polinomial, Ridge, Lasso, ElasticNet, etc.) refer to this article about machine learning methods.
Most business intelligence systems only use linear and logistic regression. This means more complex regression techniques are not available in those softwares. Additionally, more advanced methods discussed in the following paragraphs cannot be used in most of them as well. This includes Power Bi, Sisense, Tableau, Qlik, Looker, and Domo software.
Many market-leading BI systems stop at trendline and regression. As mentioned before, companies serious about predictive analysis always needed a programmer or a data scientist who could develop the necessary algorithms in Python or R, which they could then use in their particular business intelligence system.
In addition, for business intelligence systems that try to simplify the use of this feature, like Tableau, a single regression is used to match all data. This makes it easy to use, but is very inaccurate for forecasting. Tools that provide relatively better parameters, like Power BI Forecast module, can be used, but only with serious statistical knowledge.
Advantages of trendlines are speed, simplicity, and visibility of computation. The big drawback; however, is that trendlines gives inaccurate forecasts in more complex cases. If you have a relatively small amount of data, a few thousand inputs, and the trendline definition is sufficient, MS Excel proves to be a handy tool.
Dyntell Bi’s Ensemble system has an algorithm based on logistic regression called Prophet. Facebook developers began the programming, made it open source, and Dyntell Bi developed it further. In our opinion, Prophet is the best marriage between simplicity and effective forecasting with the added advantage of being well aware of the seasonality of time series.
Summary: TRENDLINE AND REGRESSION
Self-service level: High
Pros: No need for big servers for computation, quick response time, wide spread
Cons: Prediction accuracy is at medium level and doesn’t work on very large datasets
2. Moving average
In Excel the moving average is just a type of trendline. Its sophisticated usage is much more complex and can be a stronger tool than traditional regression methods. The moving average is often used in analysis of Forex or stock markets and lot of indicators us this method because it works well and we can rely on moving averages in a business time series.
Probably the most widely used moving average method is ARIMA. Read about the math behind the algorithm here.
Arima’s parameters are p, q, d where:
- p is the number of autoregressive terms
- d is the number of non-seasonal differences needed for stationarity
- q is the number of lagged forecast errors in the prediction equation.
Data scientists test different parameter settings to find the best fitting prediction for a given dataset. ARIMA is also part of the Ensemble System in Dyntell Bi where an automated process tests setting permutations and learns the best method for future use in a given time series.
Different moving average methods works well on smaller time series, but the accuracy decreases as the amount of data increases.
If you didn’t get lost on this section, you can try ARIMA for example in SAS BI. Play with the settings of p, d, q parameters to get deeper knowledge of the moving average.
Summary: MOVING AVERAGE
Self-service level: Medium
Pros: Easily understandable, quick response time, good prediction quality with the right settings
Cons: Prediction accuracy decreases as the size of the dataset grows
Want to learn more?
Stay Up-to-date
Sign up now for new trends and get an insightful case study related to business intelligence.
3. Neural Networks
Artificial neural networks are statistical algorithms modeled on the human nervous system or brain. These systems solve complex problems that are difficult for traditional algorithms, but easy for humans. Examples of this are facial recognition or natural language processing. An interesting example is handwritten character recognition, where you can imagine a grid behind the written character and can then translate the drawing into numbers: naming pixels ‘1’ where the char is, black or grey, and name ‘0’ to those pixels which are white.

In this way, you can convert images to an ordered row of 1s and 0s. After this we have to teach the network, or in other words, label the image. In this case a human being needs to say, “This row of numbers is a letter o.” The neural network will calculate from the numbers – let’s say – an energy state of the image.
The learning mechanism means that the neural network will put this energy state to the letter “o” shelf on imaginary shelves. You have to teach dozens of different handwritten “o”-s to the neural net and every time you label the image as “o” the algorithm will calculate the energy state and put this to the “o-shelf”. Of course there are other shelves for other letters and the neural network can learn the whole alphabet.
When you show the neural net a new handwritten “o” which it has never seen before, it will calculate the energy state of the image and find the appropriate shelf for this energy state. Then it will respond with the recognized character as letter “o”. More recent character recognition systems are not working in this way, but this is still an excellent example for understanding the essence of neural networks.
In the same way, neural networks learn the characteristics of time series and use them to predict future points of a curve. In these cases unsupervised networks are generally used where the algorithms can learn without the help of humans.
As you can guess, using these algorithms requires deeper statistical knowledge. You can set the size and complexity of the network and change the “energy” function, which definitely makes the method very complex. You can’t try this algorithm in any BI system, but you can test it for example, in Rapidminer. A great tool, but one that requires serious data scientist knowledge.
In Dyntell Bi, sets of neural networks are part of the Deep Prediction Ensemble System where they make classifications and predictions in a more complex system where different algorithms are connected to each other. Dyntell Bi sets the parameters of used neural networks automatically based on statistical characteristics of the time series. Dyntell Bi’s developers are actually working on using neural nets for classifying the time series to set the best possible weights and settings of the Deep Prediction Ensemble System.
Summary: NEURAL NETWORKS
Self-service level: Low
Pros: Great for classification problems
Cons: Previous experience needed to use it
4. Deep Learning
The structure of an artificial neural network consists of nodes which are connected to each other. There are nodes or neurons which are responsible for detecting the image of the “o”-character (see image below) these neurons are in the input layer. The calculation of energy is complicated sometimes and needs more nodes. These are organized in one or more hidden layers and the neural networks give back the result via the output layer (which can contain more neurons too).
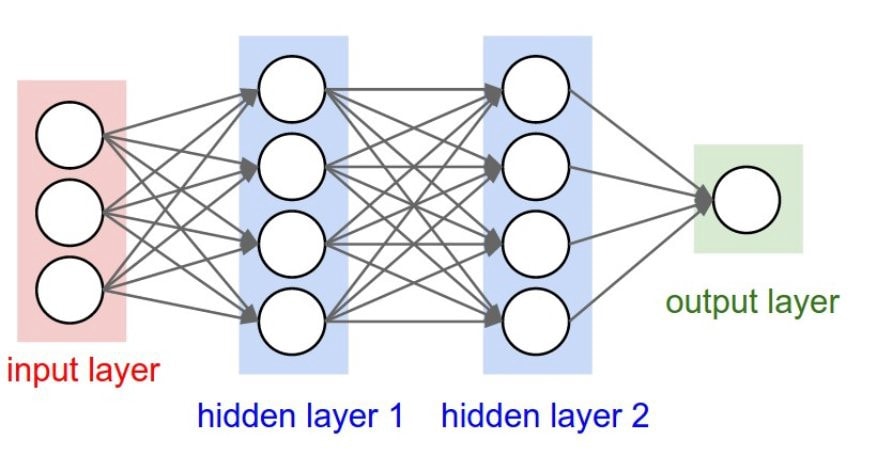
Note that this process can be seen as a kind of compression of the information. This means we compress an image to an energy state.
Deep learning comes from this somewhat crazy idea where we put compressed information from the hidden layer into an input layer of another neural network, embedded neural nets. Then the next hidden layer puts it again into a third neural network as an input layer. So we compress, compress, and compress the information again, on and on.
Deep Neural Network
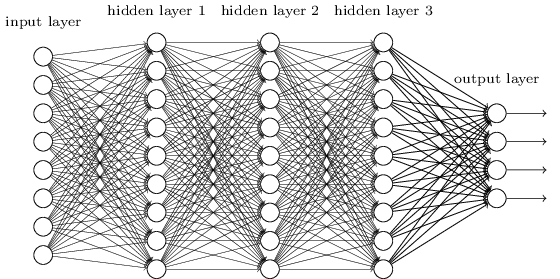
Take a look at the above image. It looks messy! How does this actually work? This is a deep learning network and yes, it works very well for large amounts of data.
The image below shows the effectiveness of a deep learning network against traditional algorithms.
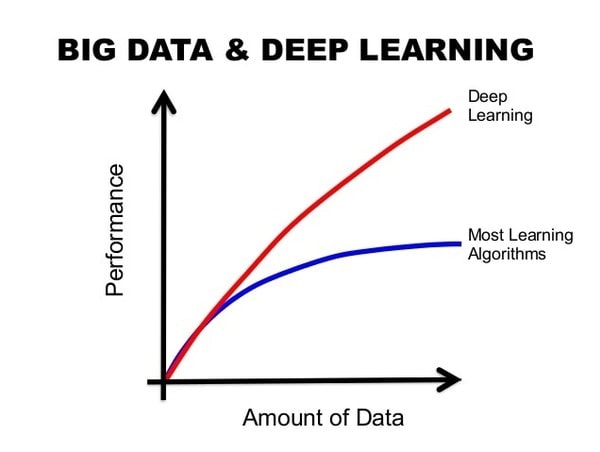
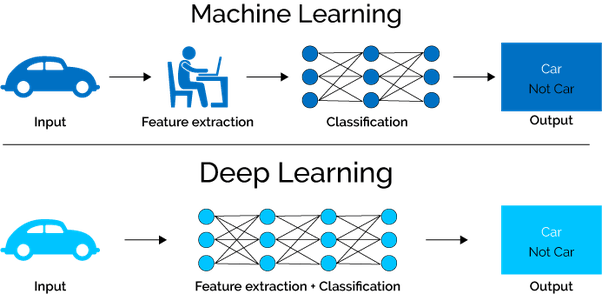
Another advantage of deep learning is the automatic feature extraction, which means you don’t need humans for labeling. This is a very important property because when the data amount is growing exponentially and we don’t have enough resources to process all of this information, deep learning networks can solve this problem for us.
If using neural networks is hard, then building and using a deep learning system is even harder. And if you don’t have enough data it probably isn’t worth the effort, because the real strength of this algorithm is to give accurate predictions based on large amounts of data.
If you use deep learning you need a specific GPU server to run deep learning smoothly. If you are a data scientist, you can try deep learning programs. in H2O.ai, KNIME, MATLAB or you can build your own network, coding in Python and using Keras framework.
Similar to neural networks, in Dyntell Bi the Deep Learning Subsystem is part of the Deep Prediction Ensemble System. Dyntell Bi sets up everything you need automatically based on the statistical characteristics of the data.
Self-service level: You need a data scientist to build a deep learning system
Pros: Automatic feature extraction and the best method for big data
Cons: Needs GPU server
5. Ensemble System
An ensemble system consists of multiple learning algorithms and the output comes from weighted results of the separate members. This method can obtain better predictions than could be obtained from any of the constituent learning algorithms alone. Just as we often seek second opinions in matters of great importance to us, the ensemble system synchronizes multiple opinions for the most accurate forecast. Learn more about ensemble systems here.
You can build ensemble systems in RapidMiner, but using this to get predictions for your business will mean getting a data scientist team with data scientist application developers and at least one very qualified mathematician.
Dyntell Bi’s Ensemble System draws predictions from two servers: one running classical algorithms and one with deep learning algorithms. It predicts more precisely than traditional algorithms and requires less data than deep learning systems. This is a very effective method in business forecasting where we don’t always have big data amounts.
You can read more about Dyntell Bi’s specific ensemble in #7 below.
Self-service level: You need a data scientist team to build it
Pros: Ensemble System unites the effectiveness of all of the previously described algorithms
Cons: You need great processing power on the server side to use it and the response time is slow
6. Correlating Time Series
Does the future of our data depend only on past patterns? In the case of stock prices, definitely not. If something happens in the world related to the stock, the price of that stock will change. If the index and commodity prices depend on external conditions does the external environment affect the sales of a given company? And if we know this external data, can we forecast the future of your business data more precisely?
Before I answer these questions let’s look into how machine learning came to be with support from big databases in the short history of artificial intelligence.
WordNet is a lexical database for the English language for more than 150k words. WordNet uses synsets to describe the meaning of a word and this database is very useful if you develop artificially intelligent software with purpose of text analysis.
ImageNet came from the WordNet idea, but this is instead a huge image database, with more than 14 million images, designed for use by visual recognition software developers.
TimeNet is a database for time series. Economical and geographical data is stored and are refreshed on a daily basis in this database. This data can describe the external economic environment and can support our endeavors to find correlation between the data of a specific company and external conditions.
You can play with TimeNet and try to find correlations between time series’, but to upload and compare your own data with other time series’ you need Dyntell Bi software.
TimeNet uses the classical correlation method and their own correlation detection method. Classical correlation seeks similarities in the shapes of curves, whereas the TimeNet correlation seeks similarity in the behavior of the time series. To compare behavior TimeNet determines the trend-changing points of a curve, local minimums and maximums, and if another time series has its trend-changing points in close proximity of time. If so, that can mean that there is a connection between the two datasets.
Play with your data here.
Correlation doesn’t always mean causation, but it can mean that in the background of the two datasets there is the same mathematical law at work. You can check out these slightly morbid but funny examples of non-causal time series with high correlation.
Although the correlation concept is used in the stock market, there is no standard business software example for the analysis of correlating time series and embedded time series data in prediction. That is, except for Dyntell Bi. For example via Qlik you can access DataMarket database but there is no possibility in Qlik to analyse the correlation among this data. Dig a little deeper and learn more on this topic.
Self-service level: High (TimeNet.cloud)
Pros: Brings new variables into predictions dependent of external conditions
Cons: You have to manage external datasets to find correlation with your data
7. Dyntell Bi “TimeNet Deep Prediction”
The TimeNet Deep Prediction method unifies all 6 levels of predictive analytics from above and adds a few extra functions to the process.
This method is available from Dyntell Bi and it’s simple to use. If you have a time series chart and start the prediction process, Dyntell Bi sends the data of the time series to the cloud. Here the Dyntell Bi GPU server cluster accepts it and starts the prediction process. This takes time, so you can use the business intelligence software in the meantime and you’ll get an alert when your prediction is ready.
The first step that happens in the cloud is the characterization of the data. A neural network algorithm determines the main statistical properties of the data.
In the second step outliers will are filtered from the timeseries, assuming there are any. Outliers can be errors or can be part of the real data. Outliers that are part of the real data are like in the case of a sales chart, there is a day where a big project starts and 100 times more sales happen. However, in both cases, error or part of the data, outliers can create a faulty result.
The next step is to find correlating data in the TimeNet Database. If Dyntell Bi finds 85% or more correlation, either classical correlation or trend-correlations, among the TimeNet time series then Dyntell Bi connects the correlating data to the observed data. The following steps in the process take this bound data into account.
Based on the characteristics, the found correlating time series, and the number of eliminated outliers, Dyntell Bi sets the parameters of the ensemble system. The ensemble process then starts on a traditional server cluster and simultaneously on another GPU server cluster.
The first cluster runs classical algorithms These are regressions and customized ARIMAs. These functions need a small amount of data to generate good predictions, but their forecasts won’t be completely accurate. The other cluster relies on neural nets and deep learning algorithms, which can process very large datasets, millions or billions of data points. If we have enough data this creates more accurate predictions.
While both methods have merit, we believe that using just one produces inadequate incomplete predictions. Since business datasets tend to be small, but require high accuracy, we integrate both methodologies. Dyntell Bi’s ensemble system draws predictions from two server clusters: one running classical algorithms and one with neural networks and deep learning.
In ARIMA and regression we can’t use correlating time series, but neural nets and deep learning can use them to create more accurate predictions.
At the end of the process, based on the preconfigured weights, the ensemble system determines the output. The required number of predicted data points are given back to the local Dyntell Bi system. Following visualization the system alerts the user that the prediction is complete.
Self-service level: High
Pros: Unites the 6 other levels of predictive analytics
Cons: It needs a lot of processing power (Classical and GPU servers)
Prescriptive Analysis
It is important to mention that after predictive analytics the next step is prescriptive analytics. Prescriptive analytics not only predicts the future, but can even help you to decide what you need to do in light of the prospective future. It can even automate the needed process. Prescriptive analysis answers the question: What should we do? This is the next step after prediction and using this means you can automate your processes to proactively treat your business issues like taking advantage of an opportunity or preventing a problem.
Prescriptive analysis can be managed by alerts. A sophisticated alert system or workflow system is a must-have in a modern business intelligence software and you need this to automate control in your company. To demonstrate the strength of prescriptive analysis here are 3 case studies.
1. Costa (a Coca Cola subsidiary)
Costa is a coffee shop chain and Dyntell Bi analyzed the aggregated data of their locations. The predictive analysis forecasts the future transaction numbers by shops. This helps Costa to manage their human resources effectively via prescription of the baristas by shops, just enough employees in a given shop, and alerts the management if a possible unexpected event might happen.
Costa isn’t using TimeNet, but the algorithm is analyzing the past data patterns, weather data, location, and time of bigger events. At Costa, Dyntell Bi’s deep prediction can give a forecast with about 90% accuracy.
2. Ana Pan
Ana Pan is one of the largest bakery enterprises in Europe and they are using Dyntell Bi’s predictive and prescriptive analytics to forecast their sales for shops and drive the company’s manufacturing based on this. They are using TimeNet correlating data and deep prediction server clusters to predict the number of products that have to be manufactured and the number of products that have to be delivered to a given shop. The Dyntell Bi system automatically connects the predicted data to Ana Pan’s ERP system, where the forecast goes directly to the production planning and logistic planning modules.
Prediction has monumental importance in the food industry because of product expiration dates. If you can predict just a 1% increase in sales then you can decrease the amount of waste. A 1% improvement can mean thousands of dollars in savings a week.
*Disclaimer: Ana Pan did not contribute to publish their prediction efficiency percentage.
3. Johnson Controls
Johnson Controls is a globally diversified technology and multi-industry leader producing automotive parts such as batteries, electronics, and HVAC equipment for buildings. In a subsidiary of the enterprise, the Dyntell Bi Deep Prediction system is used for cash flow planning and control. A very sophisticated prescriptive workflow system observes the cash flow and alerts the appropriate user if something is, or tends to be wrong.
At one level they are using TimeNet in cash flow planning, but the main value for the managers is the automated alert system which can predict the trends, prescribe the necessary actions, and gives very detailed financial info if needed.
Which Prediction is Best for You?
First of all you need to determine what the value of a good prediction is in your case. If possible, try and calculate the additional profit you could gain.
The next thing to consider is dependent on the amount of available business data you have. If you want to know your cash flow prediction in the next 12 months and you have 3 years of historical data, then that probably isn’t enough for a good prediction. However, that same amount of data can be perfect for predicting next week’s financial transactions.
What about if you wanted to forecast next week’s sales for a given product, and you have 30 years of data but only 10 sales events during the 30 years? Well, you might be looking at a mission impossible.
If you have lots of random outliers like how there are irregular big project revenues in sales, then you have to first clean your data. This is so it’s easier to use built in outlier filters in the prediction.
Does your data correlate to some other time series? Is the main raw material of your product on the commodity market? Are you curious to know how your data depends on economic, geographic, or Google search data? In this case, use big data stores such as TimeNet.cloud or Dyntell Bi to check out the correlations.
A self service solution is the key component in your predictions. If you’re not a mathematician or data scientist, don’t try to learn the complex systems under the hood. Choose a 1-click function to use this feature in your daily operations.
In January 2018 Gartner issued a survey about “How to Operationalize Machine Learning and Data Science Projects.” The team found that over 60% of data science models developed with the intention of operationalizing them were never actually operationalized.
If forecasting is a strategic question in your business then you need a professional team, internal or outsourced, who will help setup and maintain the data sources and methods of a good quality prediction.
But before building your own team, check out Dyntell Bi. With its 1-click prediction and some of the most sophisticated ensemble systems and big data correlations available on the market, we’ve created a solution that bridges the gap between you and your data.
Find out how Dyntell Bi can help you make better business decisions, save resources, and boost revenue. Register for a Dyntell Bi demo here.