Price sensitivity is a key measure in most industries, especially those with many competing products (FMCG, for instance). Price sensitivity is measured in the economic theory via price elasticity of the demand function. In other words, how demand for a given product is affected by a change in price. High elasticity means consumers are willing to purchase even with increased costs. Inelasticity, on the other hand, means even a small price bump will significantly reduce purchasing. What we want to find is the ‘equilibrium price’, the point where supply and demand meet to maximize revenue.
There are many factors to consider when discussing price sensitivity: competition, uniqueness of the product(s), buying process, etc. Other things to consider could be shared cost, like when a group shares a hotel room—buyers aren’t as sensitive to the total cost. Exclusivity, scarcity and prestige also come into play for high ticket items. Businesses work tirelessly to shift customer focus away from price towards things like value, benefits, lifestyle, image and more. Think of L’Oreal’s slogan, “Because I’m worth it.”, justifying the extra expense as a type of indulgence because, after all, you deserve it.
 Creating a model for measuring price sensitivity
Defining the Sweet Spot
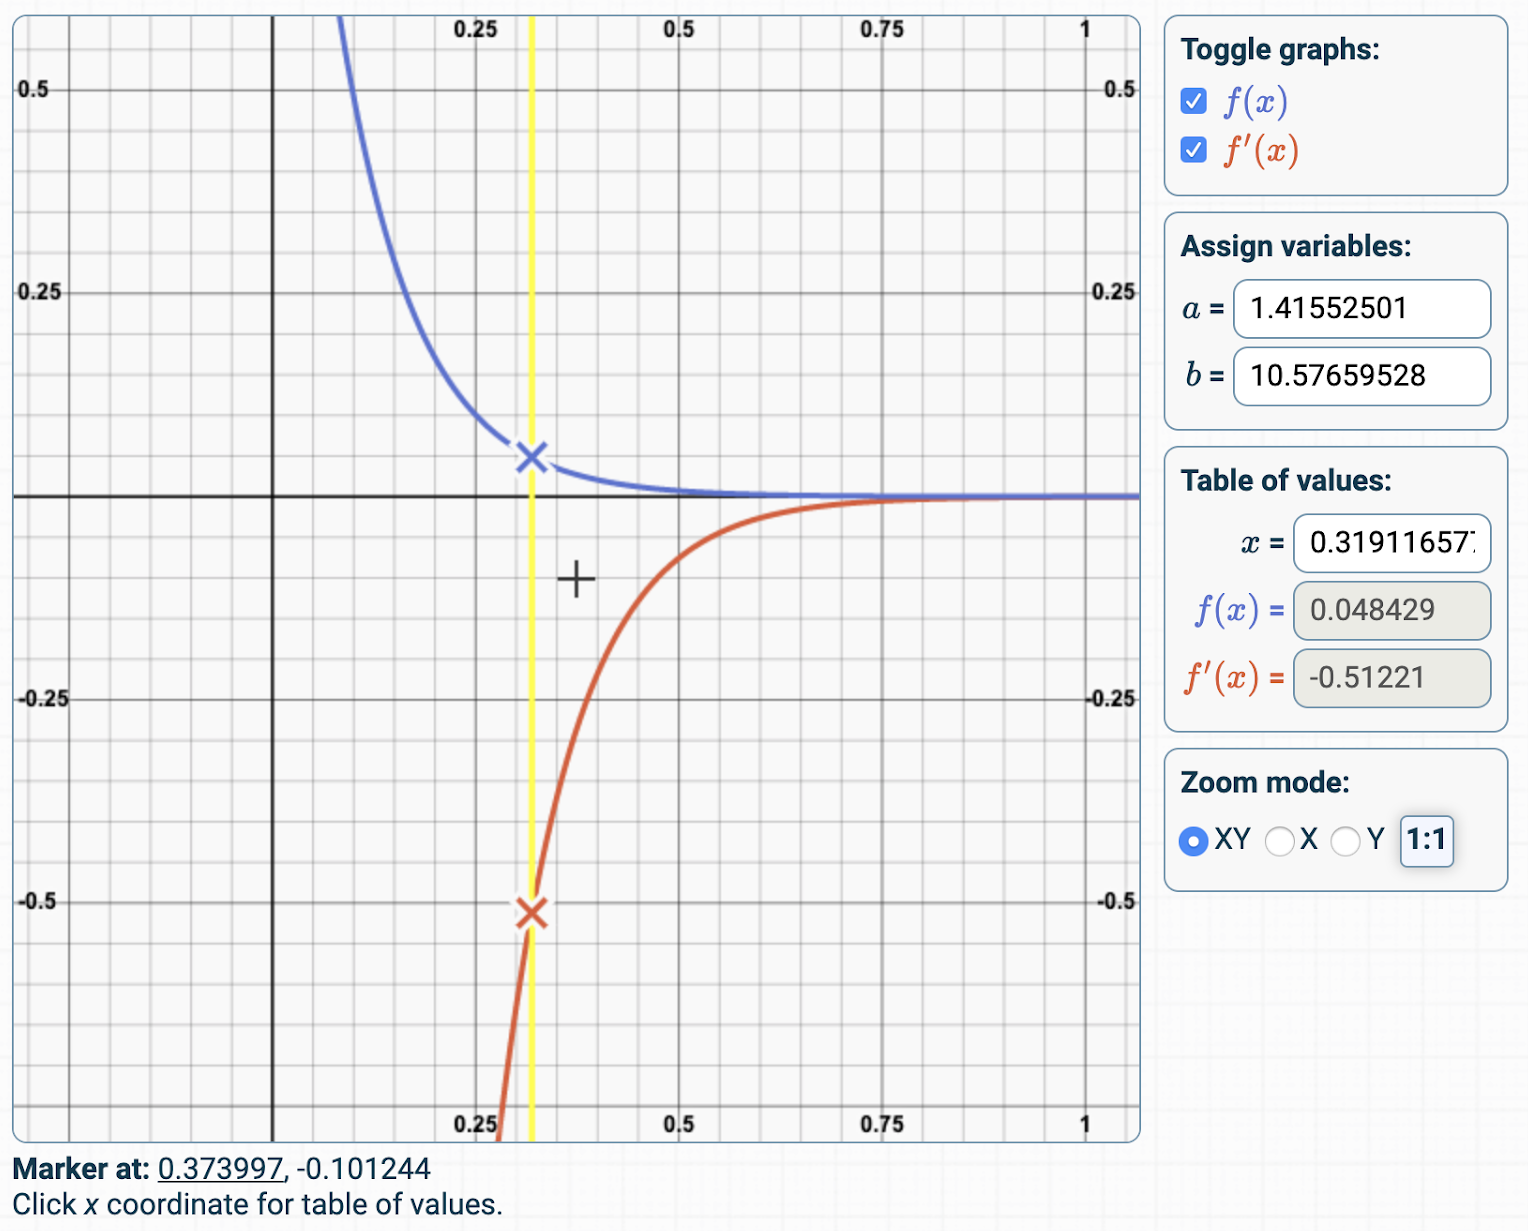
In practice demand function is typically hard to define. When we offer price elasticity calculations to our clients within our BI solution, we collect shelf price data (mostly time based averages like per week sales data, which work perfectly) and demand. We then calculate either from market share (rarely available, and ‘volume shares’ must be used as ‘value shares’ already contain the effect of pricing) or simply from sales. Working with indexes versus previous periods makes life a bit easier. Using price as the dependent variable and quantity (share or sales) as independent, we have to find the best model to fit the curve.
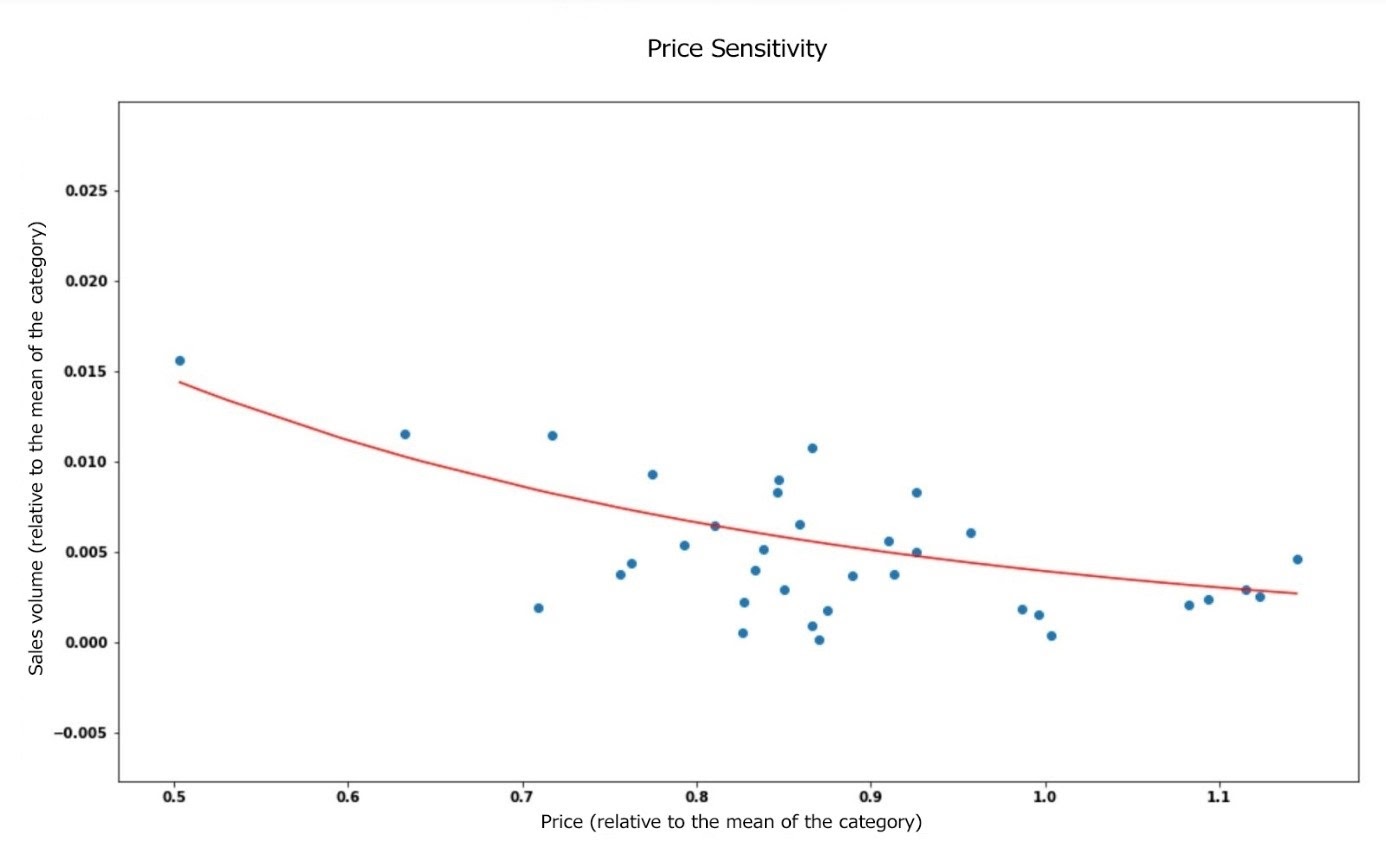 Measuring price sensitivity based on the mean sales volume of a product category and the mean price relative to the product category.
In most cases, between timely price and quantity changes, there is an inverse proportional relationship. If the price goes up, the sales volume goes down and vice versa. In many cases, linear models fit the dots just fine with an average R2 (coefficient of determination) value of 0.4-0.6 and display the aforementioned relationship quite accurately. The big advantage of the linear model is that its steepness is constant.
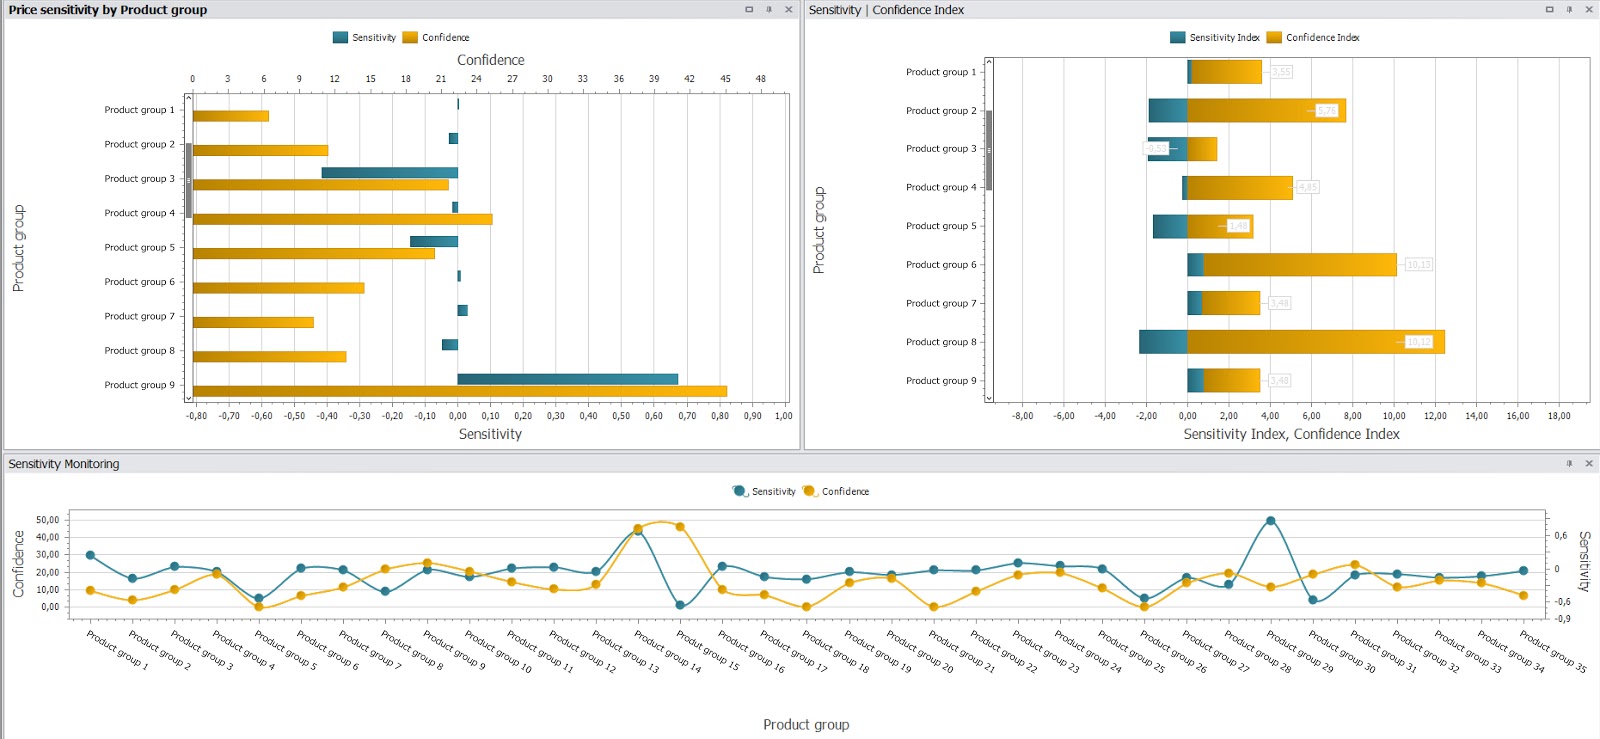 BI Dashboard Screenshot Upper left and bottom (two view types): Price sensitivity by product group – For some products, we can see that price sensitivity is almost at zero which means we’ve found ‘price equilibrium’. Upper right: Sensitivity/Confidence Index – In order to assess the average sensitivity and accuracy position of a product within a category, we calculate and index to compare that given product to other products of the same category. Lower values mean lower sensitivity/accuracy versus others within a category.
Brand value and price sensitivity
Based on our experience, at established brands where price sensitivity matters most, the best fitting models are non-linear ones. This brings two additional problems, however: first the steepness of the curve depends on the position we are at on the curve (so the steepness itself is a function of the position) and the second being that the direction of price change is not equal. Yet, it is still matching in many cases with the intuition of 1) an already overpriced product brings much higher sales erosion if priced further and, 2) price reduction brings bigger gains than the loss of price increase on the same level. And these insights are in line with the reality at brands possessing solid brand equity (‘brand value’, which can be separated from its price) and in cases like this, the adjusted R2 of the models goes up to 0.7-0.8.
Here we’ve highlighted just one great usage of price sensitivity calculations, and being able to show clients how established their brands are (assessing from the explanation power of the models) as well as how sensitive they are to pricing changes (how steep the fitted curves are). This is on top of answering the number one request of, “How much more product will I sell if I make a temporary price cut or a sale?”. Price sensitivity clustering and conditional price sensitivities are just further icing on the cake.
A study done by Harvard Business School researchers revealed that just a 1% increase in pricing accuracy can create upwards of an 11% boost in revenue. Simply put, that makes pricing one of the most impactful factors a business can leverage. Surprisingly most leaders still don’t take advantage of technologies available to them and the pricing insights they offer. Your customer’s price sensitivity and further insights from that data can unlock a world of new opportunities. So what are you waiting for?