We’re in a state of global emergency never before seen on this planet. People across the world are locked down at home, a novel virus continues taking lives and infecting new victims, and our economies are devastated. There seems to be a glimmer of light at the end of the tunnel in some countries, however, as new cases and deaths are dropping.
While it may be hasty, many are already looking ahead towards re-opening and picking up the pieces of our shattered financial reality. And it’s not looking pretty. Essentially all restaurants, bars, and places of socializing are shuttered. Almost all shops selling consumer goods, aside from groceries, are closed (some northern European countries have reopened non-essential services). Demand has all but disappeared; people aren’t spending enough to fuel recovery. Many governments are rolling out stimulus packages to lessen the pain but unfortunately, we can liken this to putting a bandaid on a wound that needs stitches. Lots of them.
Just how bad is it? Well, let’s compare our current (developing) crisis with the 2008 recession and see what we can find out. Obviously they are very different animals but it’s worth investigating to see what we can glean.
2007-08 Crisis
The plot below shows the (normalized) performance of 3 stock indices during the financial crisis of 2007-08 from different parts of the world: the Nikkei 225 from the Tokyo Stock Exchange, the FTSE 100 from the London Stock Exchange, and the Nasdaq 100 from the Nasdaq Stock Market in New York.
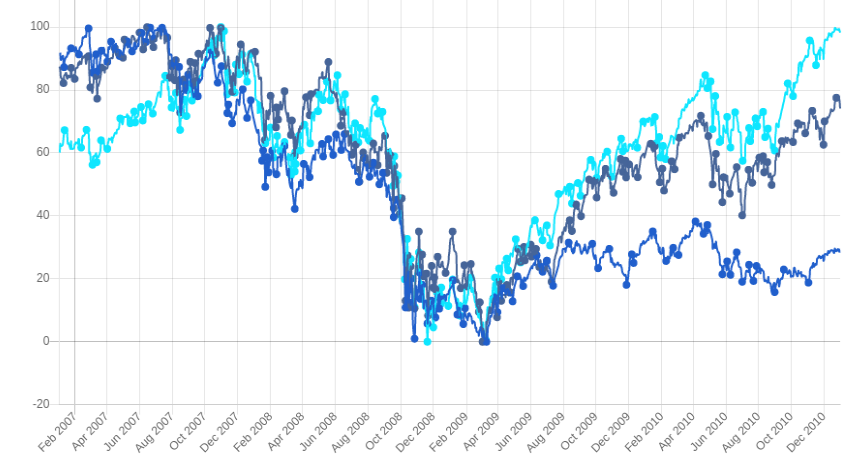 During the crisis and the subsequent recovery, the stock indices showed high correlations. The FTSE-NIKKEI and FTSE-Nasdaq correlations were about 0.85, the Nikkei-Nasdaq correlation was about 0.58.
| Correlations | Nikkei225 Index | FTSE100 Index | Nasdaq100 Index |
| Nikkei225 Index | 100.00% | 86.06% | 58.52% |
| FTSE100 Index | 86.06% | 100.00% | 85.47% |
| Nasdaq100 Index | 58.52% | 85.47% | 100.00% |
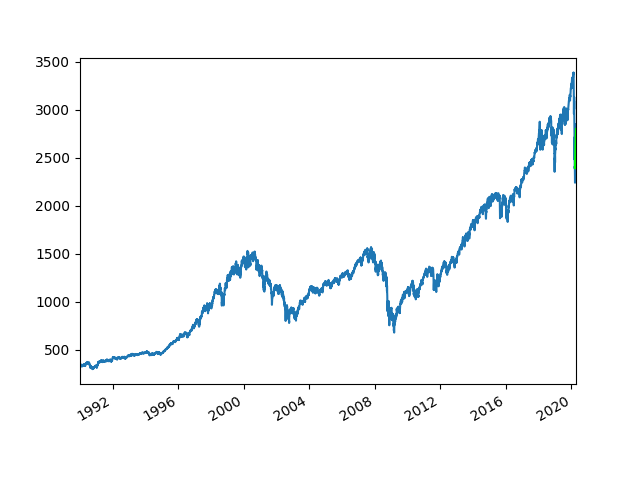
From its peak value in October 2007, the S&P 500 index (which is a good representation of the entire US stock market) dropped nearly 56% in less than a year and a half.
Recovery
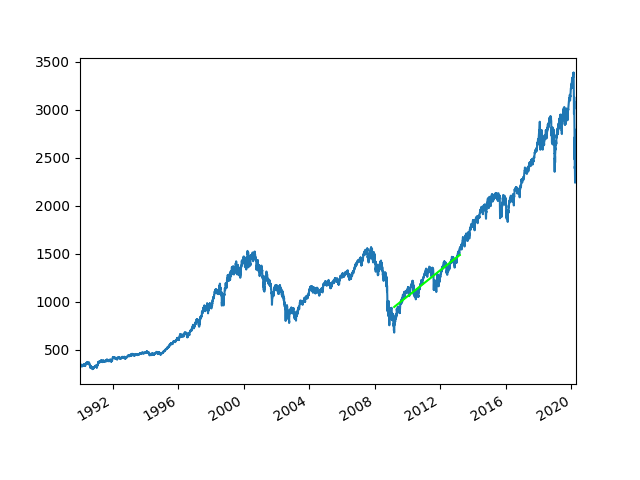
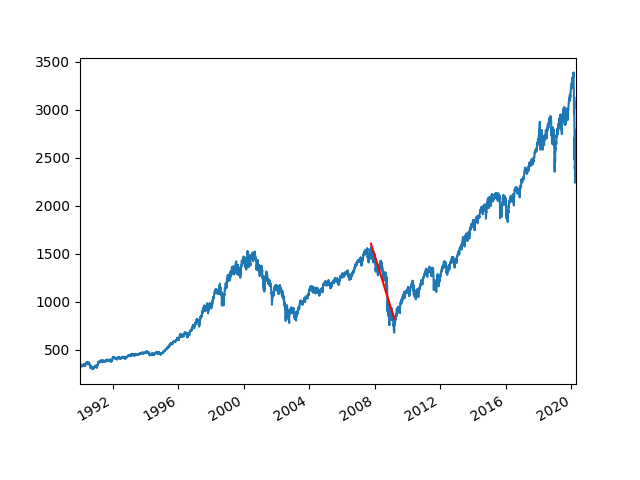 Then, it took 4 years to recover the losses.
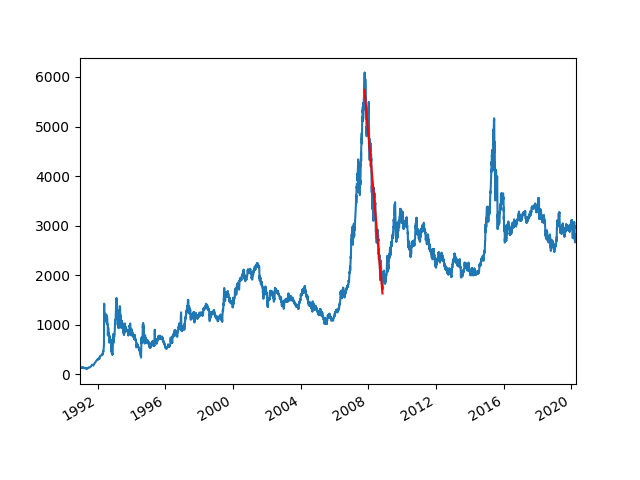
 The case was worse for the SSE Composite Index which is composed of stocks traded at the Shanghai Stock Exchange. After its peak in October 2007, the index dropped almost 72% of its value in just over a year, and it has not yet recovered.
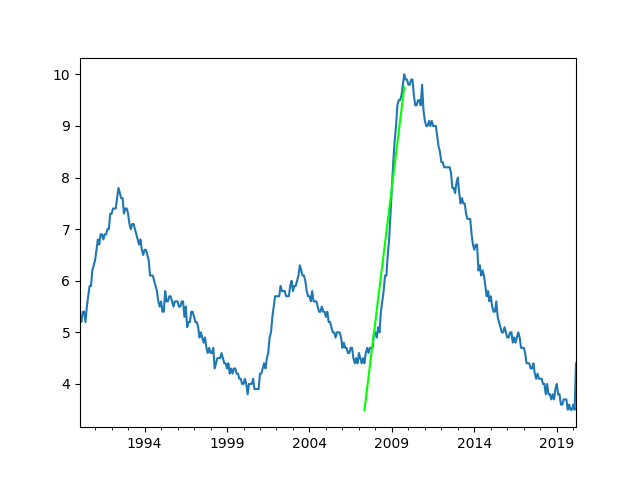
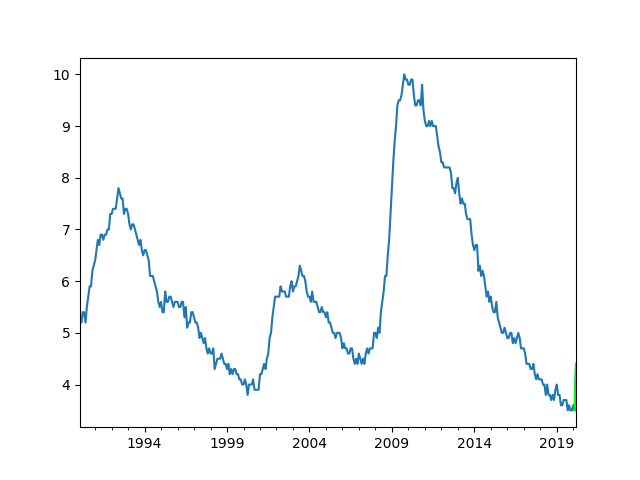
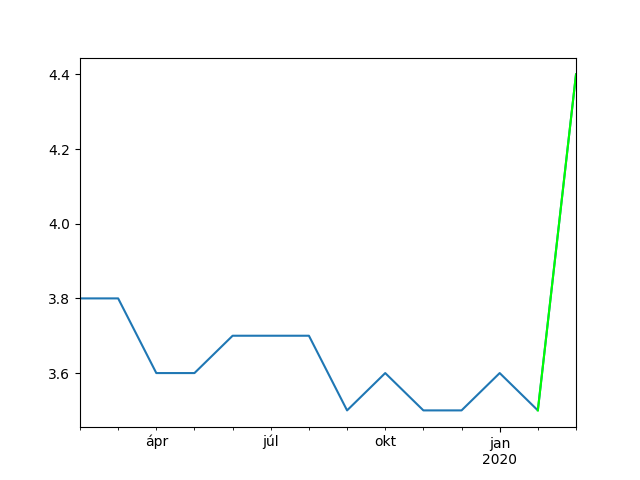
 The US unemployment rate hit 4.4% in May 2007 and climbed to 10% by October 2009.
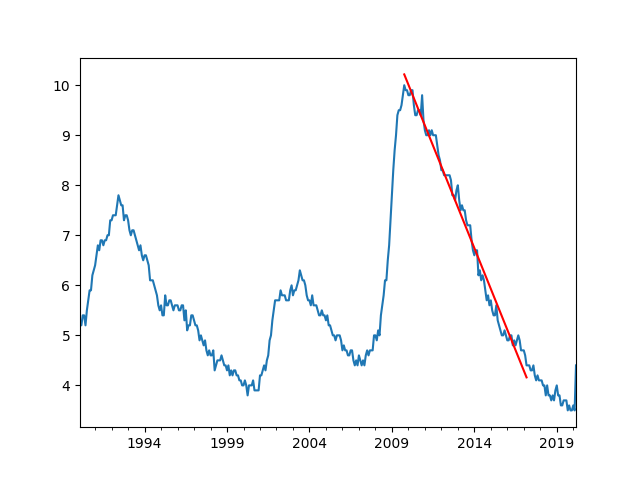
Recovery
 And US unemployment took more than 7 years to recover.
2020- Coronavirus Crisis
The following plot shows the (normalized) Nikkei 225, the FTSE 100, and the Nasdaq 100 indices in 2020.
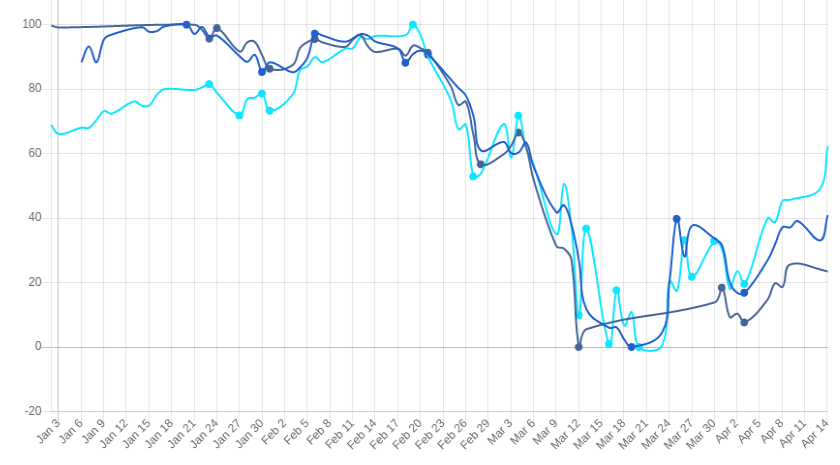 The correlations are similarly large as in the 2007-08 period.
| Correlations | Nikkei225 Index | FTSE100 Index | Nasdaq100 Index |
| Nikkei225 Index | 100.00% | 83.50% | 86.40% |
| FTSE100 Index | 83.50% | 100.00% | 57.51% |
| Nasdaq100 Index | 86.40% | 57.51% | 100.00% |
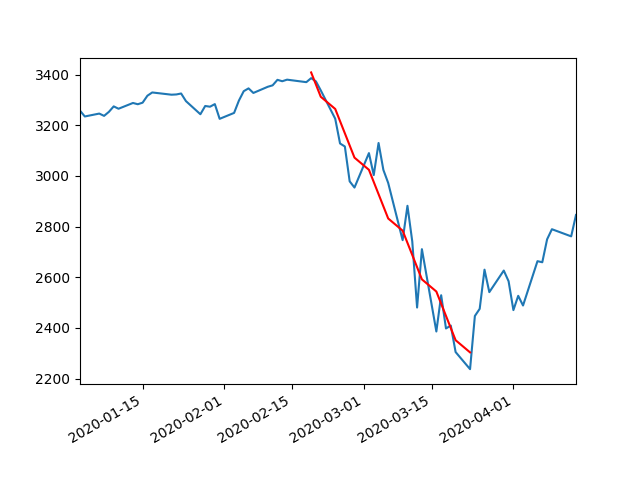
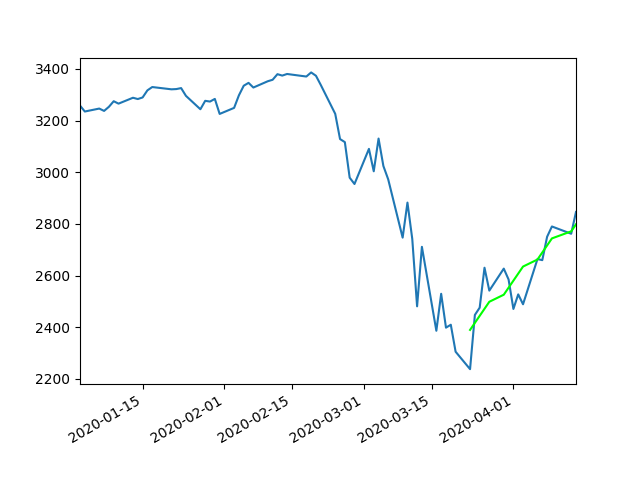
 The S&P 500 index lost almost 34% of its value in just 33 days (insanely fast).
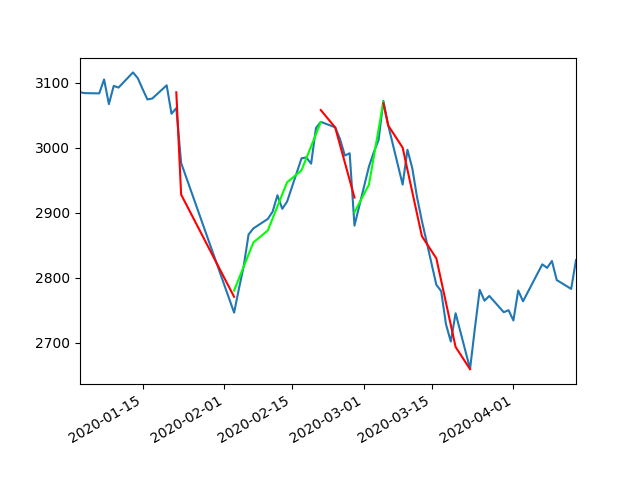
 In 22 days, the S&P 500 recovered almost 53% of its losses. Does a quick drop imply quick recovery?
 The SSE Composite index is more varied. There were multiple downturns this year. The first two have recovered, the third (and largest) is creeping up with less confidence.
 What about unemployment? All we see in the data is an almost 26% increase from February to March.
Conclusion
So what have we learned from comparing the 2008 recession with the current COVID-19 crisis? Well, most obvious is the fact that everything has happened much faster now than in 2008. We also can’t be sure that we’ve seen the bottom of the market yet. And if we have, it seems likely that we’ll have a quick recovery.
In terms of unemployment, we still don’t have enough data from the labor market to make conclusive predictions. It’s unknown how growing unemployment will affect the economy and how long it will take for things to normalize (or more likely create a new normal).
Despite different stock indices showing strong correlations, there may be significant differences in the pace and shape of the recovery. Our current crisis is absolutely novel, just like the coronavirus. This uniqueness means uncertainty blankets every corner of our economy and, consequently, history simply doesn’t provide enough data.