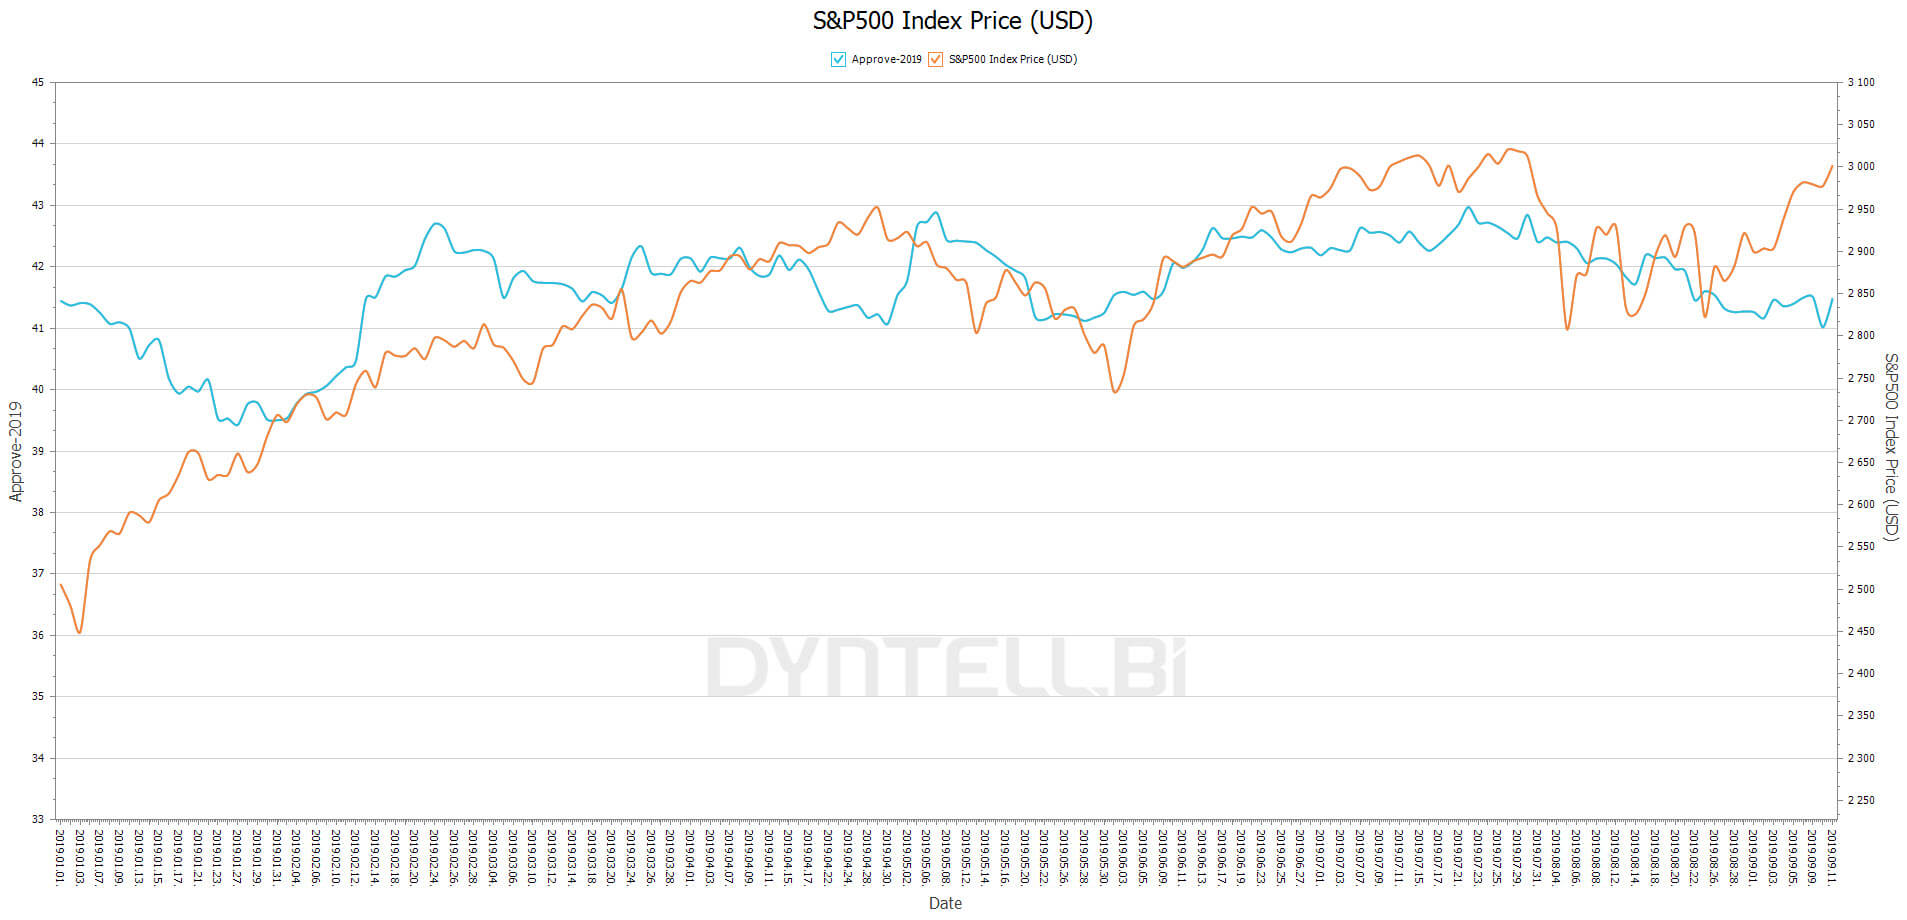
A little over 17 months ago Bloomberg analyzed the correlation between the S&P 500 and President Trump’s approval rating. And the article’s key takeaway wasn’t exactly positive. From July 2018 to April 2018, there was a clear negative correlation between stocks and the daily running approval ratings from Rasmussen Reports. Bloomberg writer Brandon Kochkodin’s conclusion: “Trump’s rhetoric is riling up his base while also scaring the markets”.
Dyntell’s data scientists were curious about how this trend has changed since, and we found something quite interesting starting early 2019 based on FiveThirtyEight statistics.
We used TimeNet.cloud to find a correlation and the charts below show results from January 2019 to August 2019.
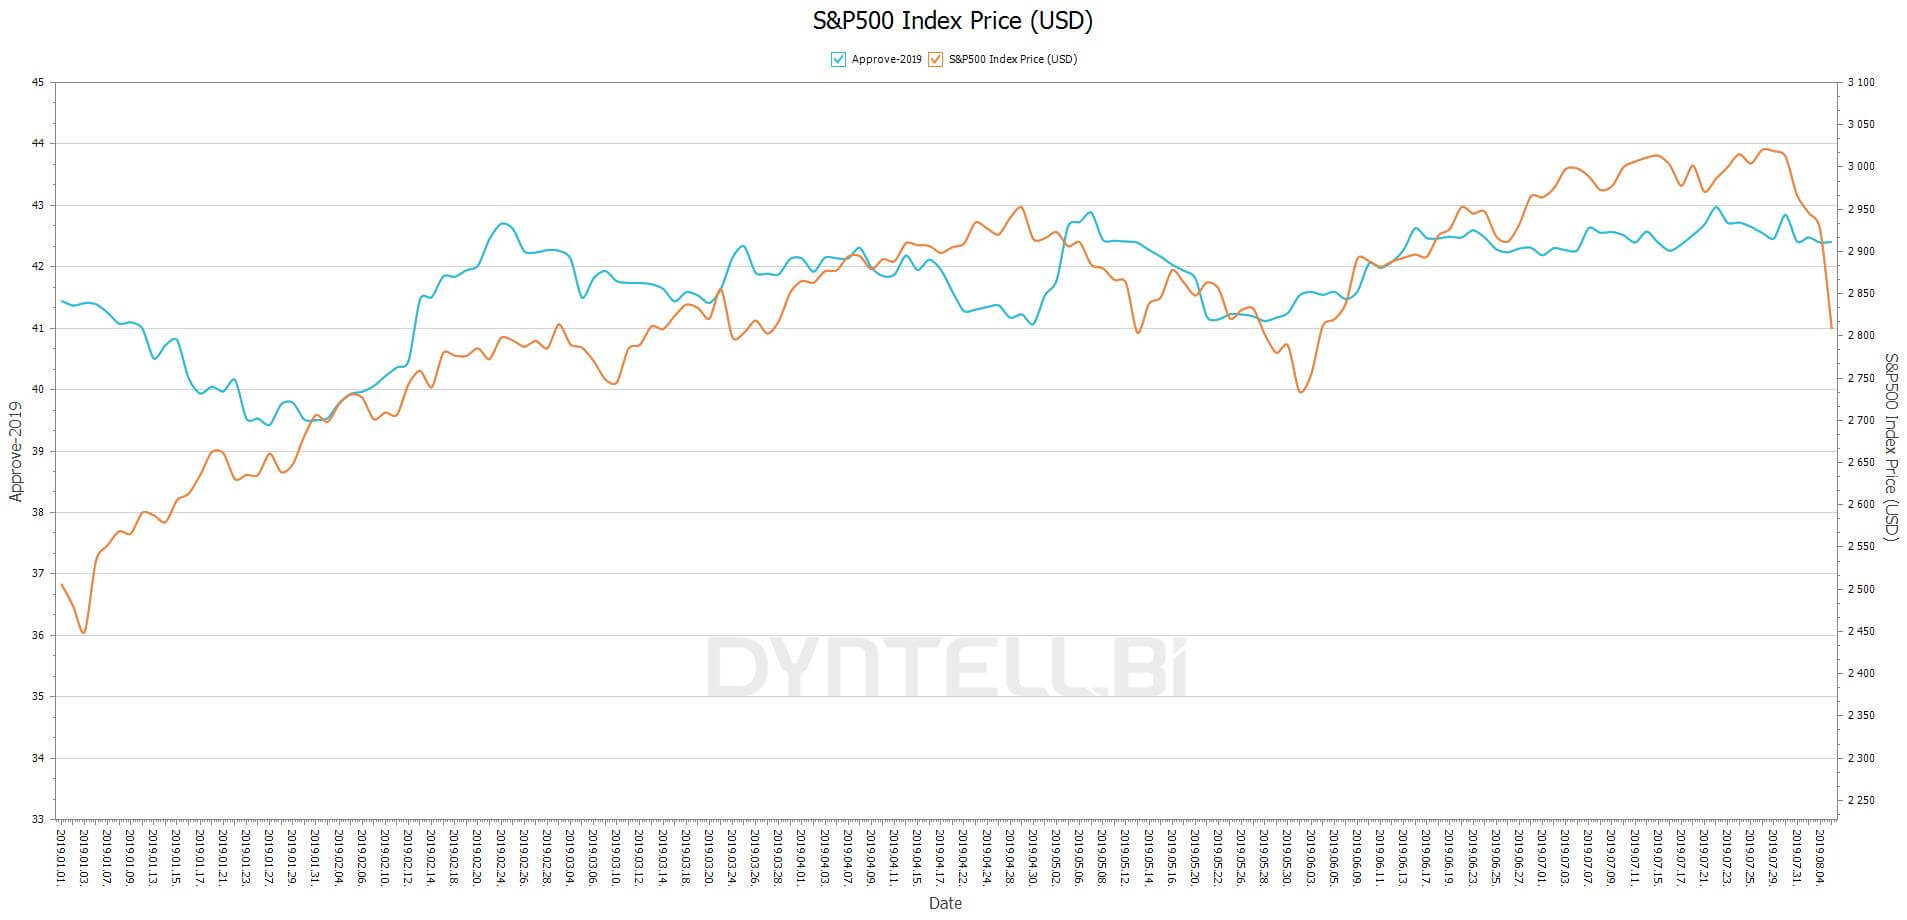 Correlation between S&P 500 Index Price (USD) and approval rating of President Trump from Jan 2019 to August 2019 (69.19%)
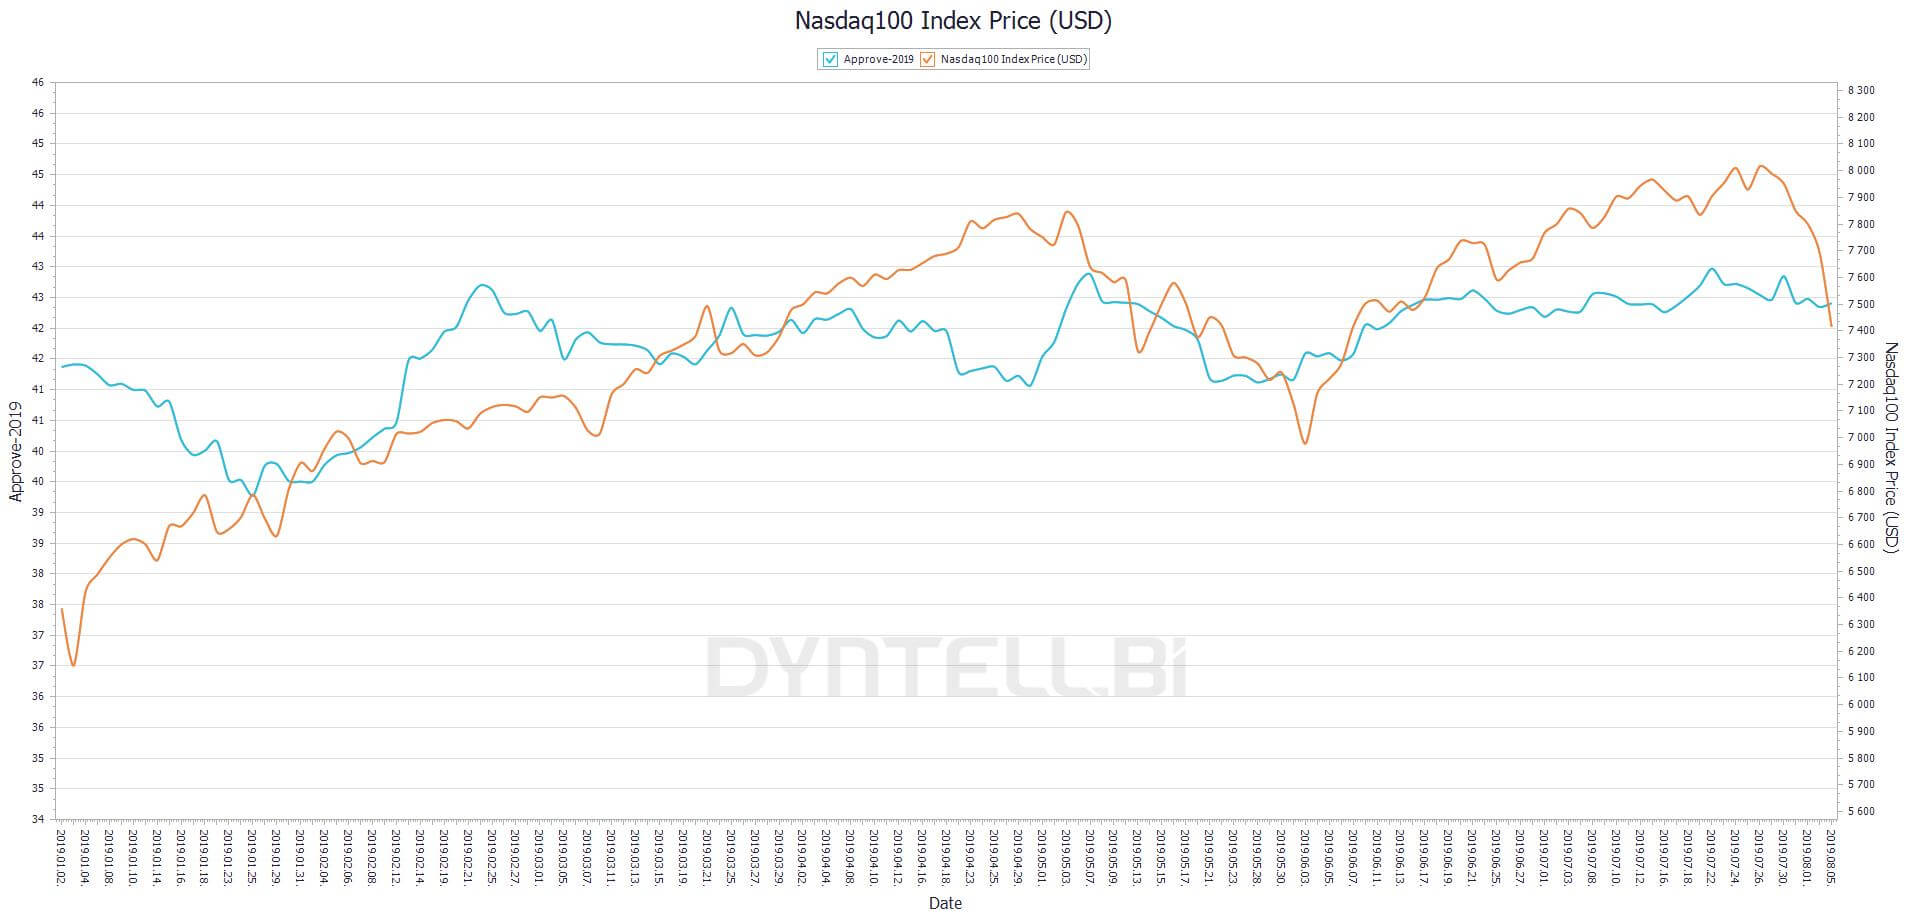 Correlation between Nasdaq 100 Index Price (USD) and approval rating of President Trump from Jan 2019 to August 2019 (68.91%)
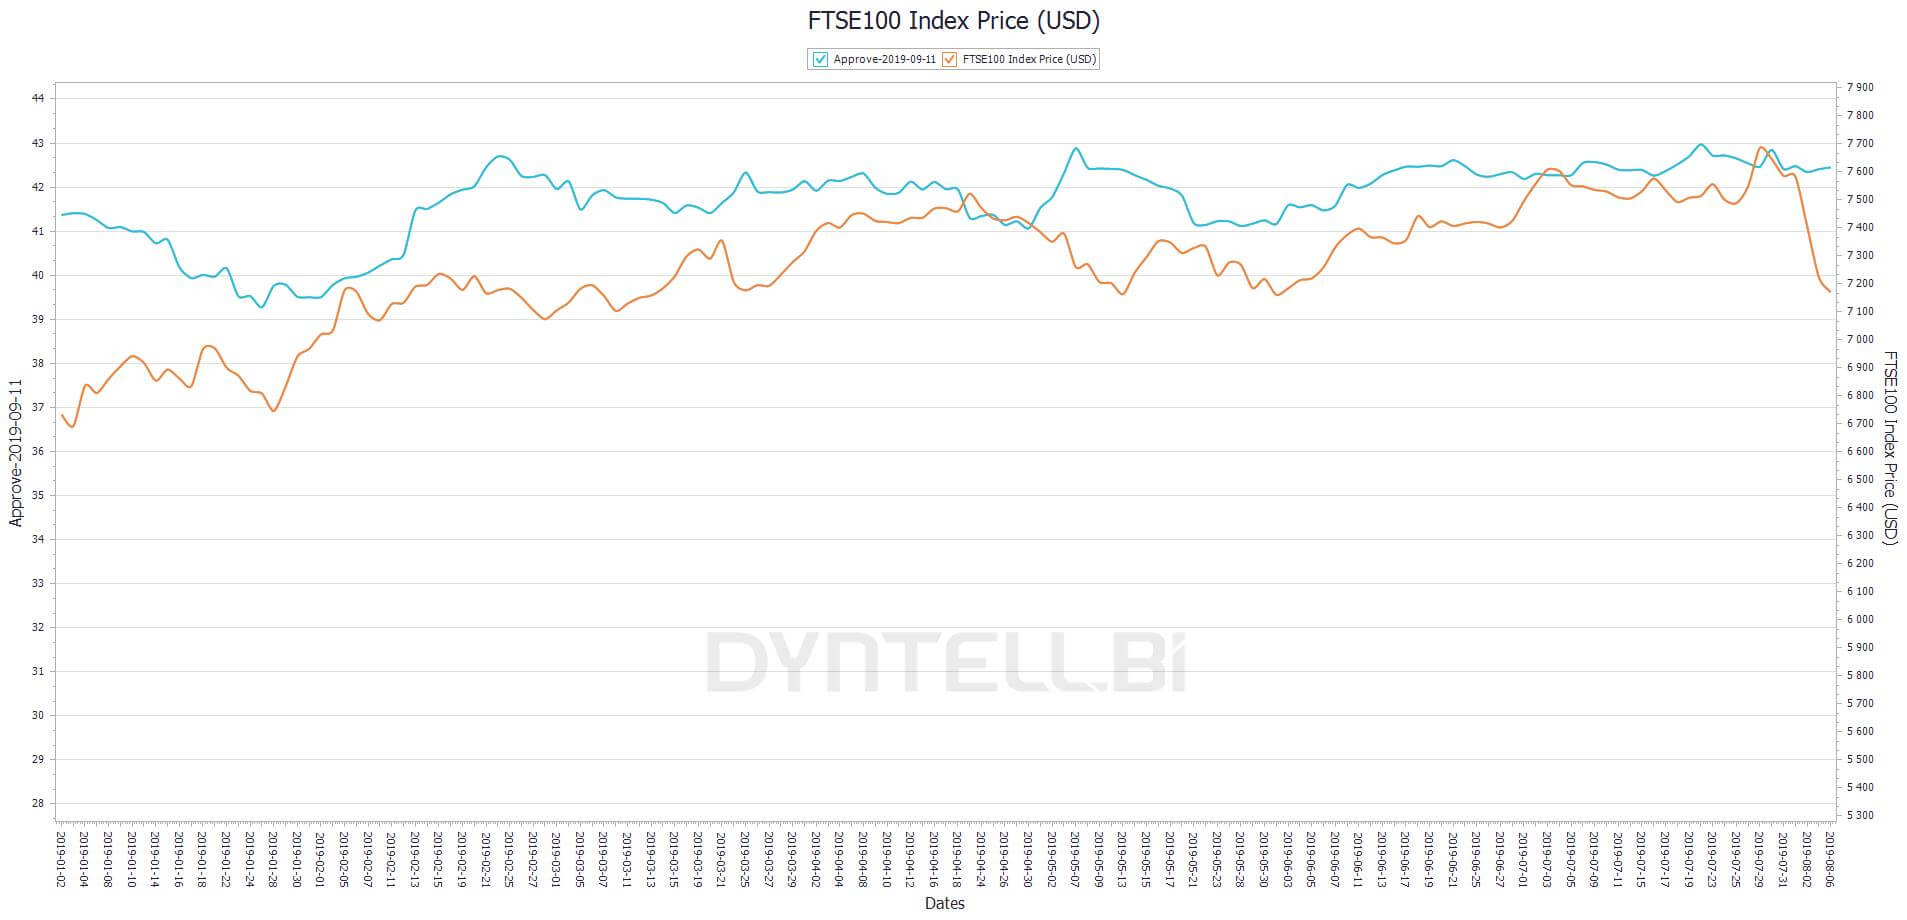 Correlation between FTSE 100 Index Price (USD) and approval rating of President Trump from Jan 2019 to August 2019 (69.8 %)
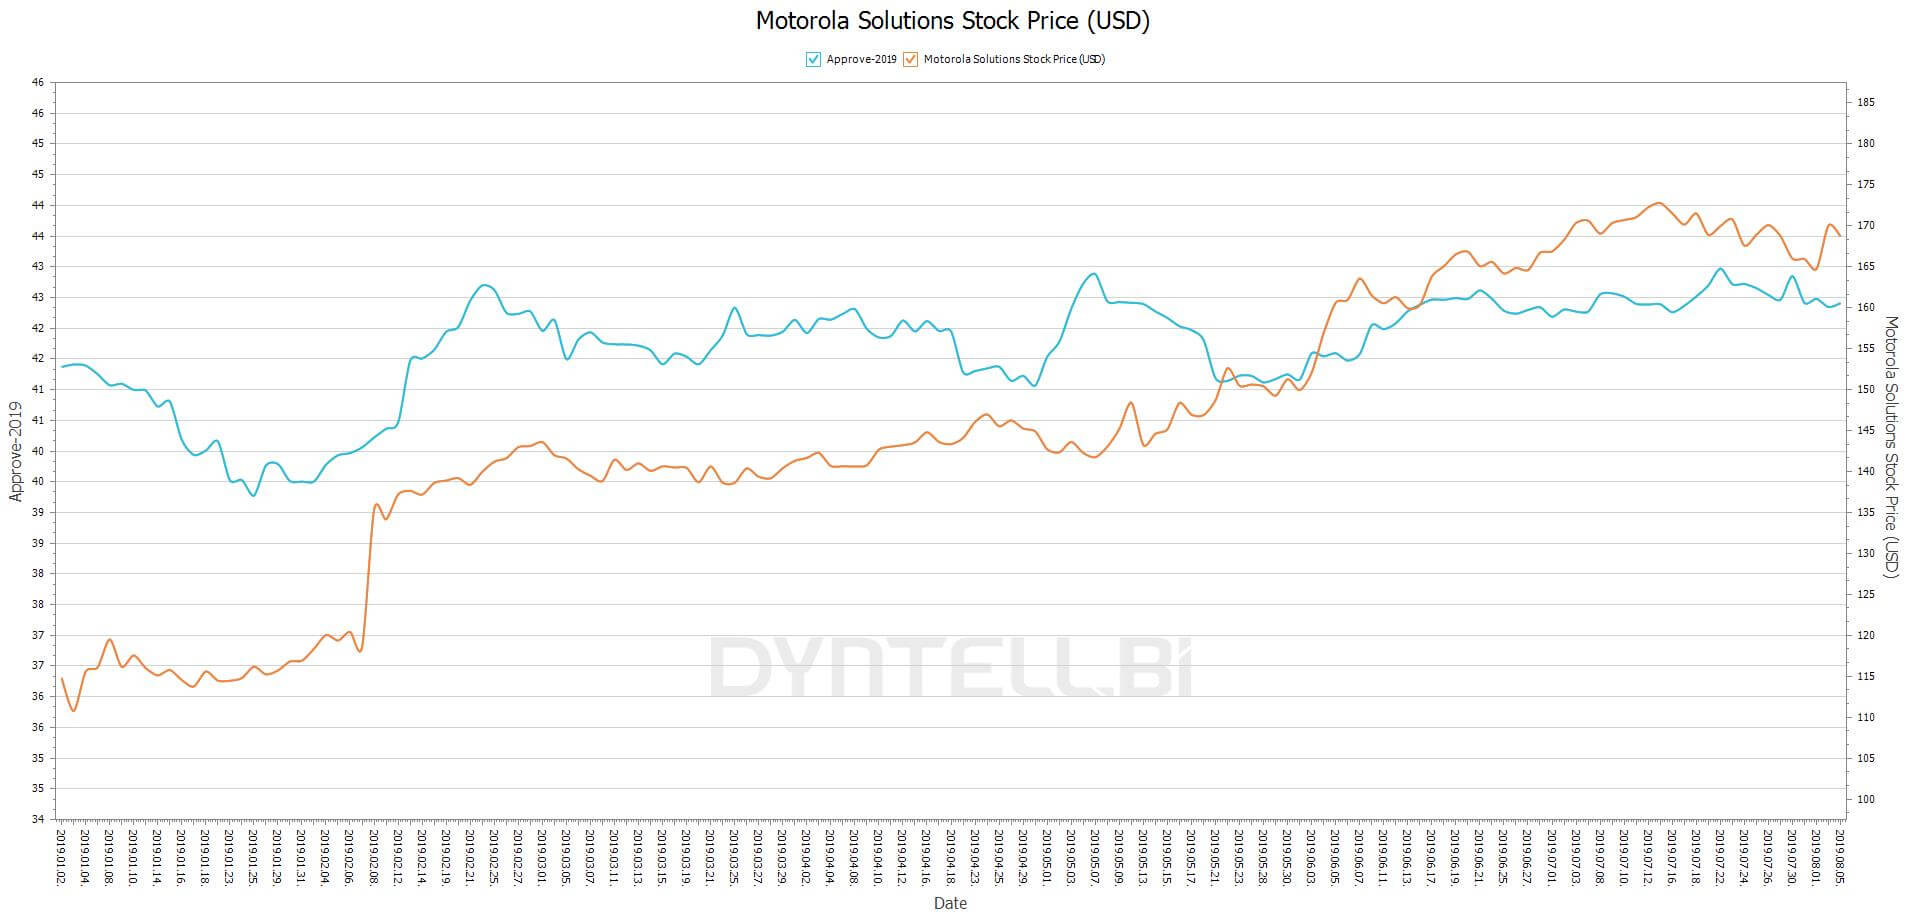 Our best hit – Correlation between Motorola Solution Stock Price (USD) and approval rating of President Trump from Jan 2019 to August 2019 (75.64%)
These results could mean that the trend has done an about face and that stocks and Trump’s approval rating now have a strong positive correlation.
Want to learn more?
Stay Up-to-date
Sign up now for new trends and get an insightful case study related to business intelligence.
When we did the same analysis with the data from August 1st to September 11th, we saw that the correlation is decreasing. And in August the two time series had movements in different directions. You can check it out on the updated S&P chart:
Correlation between S&P 500 Index Price (USD) and approval rating of President Trump from Jan 2019 to September 11, 2019 (64.46%)
So we concluded that there is indeed a correlation. But which is the cause and which is the effect? The answer is timing. Drilling down into the chart we can see the following pattern:
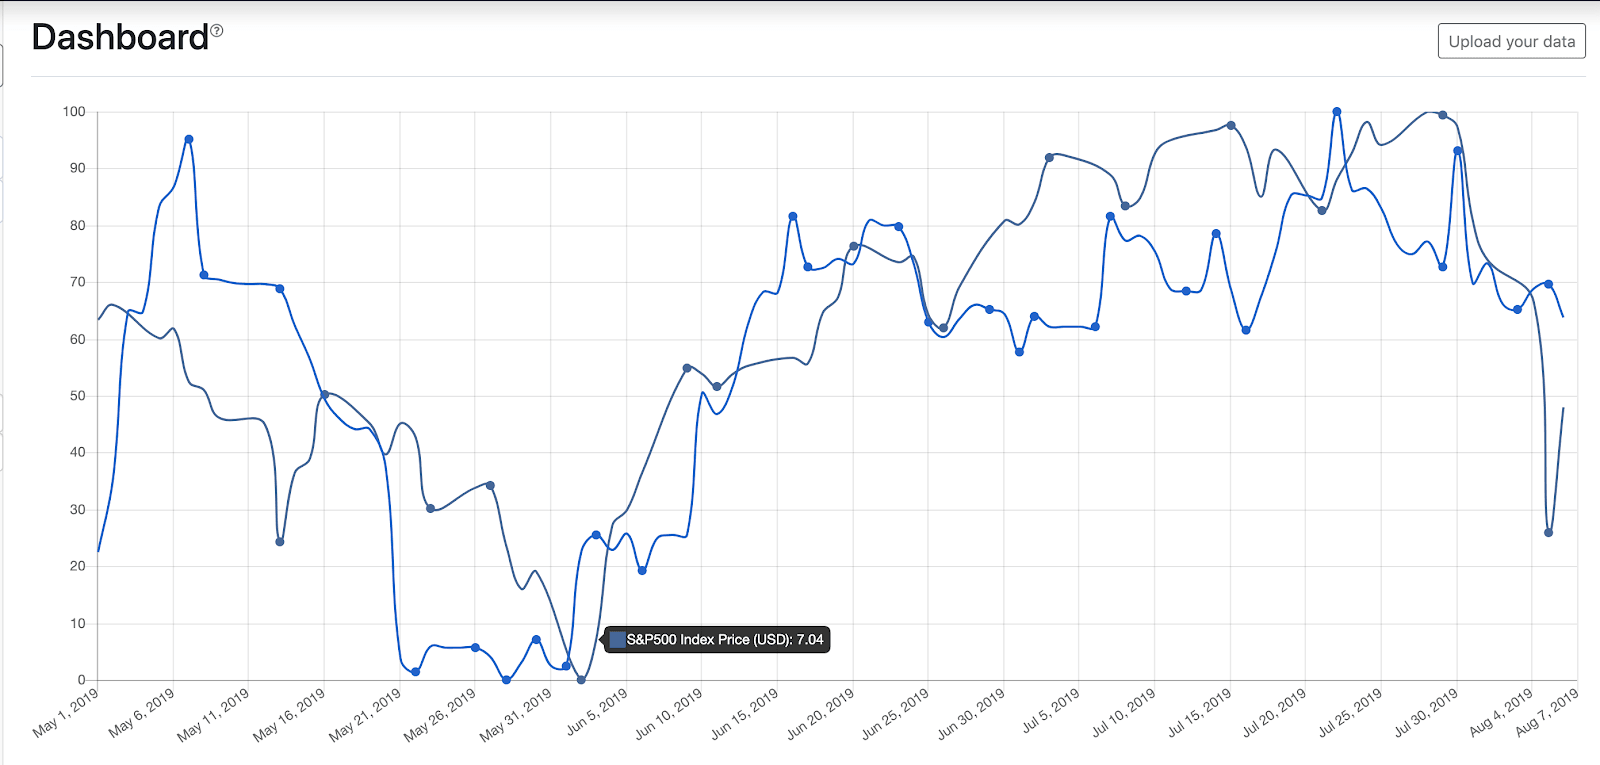 “Cause-effect analysis” of time series
By enlarging the image above you can see that sometimes the S&P pulls Trump’s approval rating, and sometimes Trump pulls the S&P. The situation is the same for the Nasdaq, too, so we can’t currently answer the question of causality.
We applied TimeNet’s trend-correlation technique to find how the trends on these time series correlated with each other. The plots on the curves show the points where trends turned (local minima and maxima). But what exactly does this mean? Well, if these points are close together on both time series there’s a good chance they have a tight dependence on each other.
If the trend-correlation value is high (more than 50% or less than -50%) for two time series in the case of a long time interval, that can indicate a deeper connection between the data. This can happen if one curve deviates from the trend causing the other to follow quickly behind.
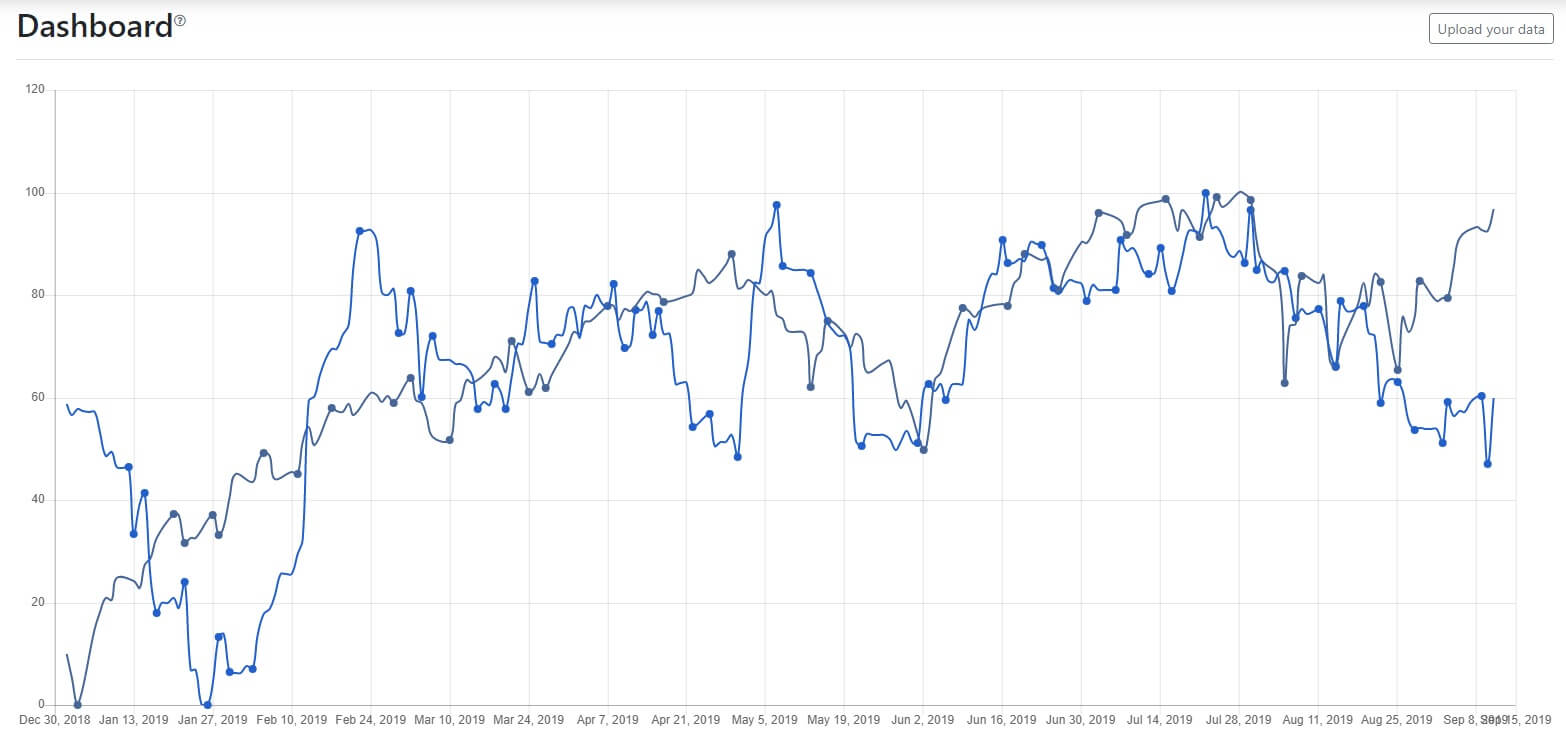 TimeNet Trend Correlation Analysis for S&P 500 Index Price (USD) and approval rating of President Trump from Jan 2019 to September 11, 2019 (-2.84%)
The TimeNet trend-correlation values for all of 2019 (concerning the above indexes) are around 0% (S&P 500: -2.84; Nasdaq 100: -2.87; Motorola: -2.87), except FTSE 100 which has quite a high positive trend correlation value: 53.07%. In other words, the trends on Trump’s approval rating don’t fit the stock market trends. This could mean that the driving force of the two time series are different and the high correlation rate can simply be a coincidence. But we can’t explain the high correlation between the FTSE 100 and Trump’s approval rating on the image below.
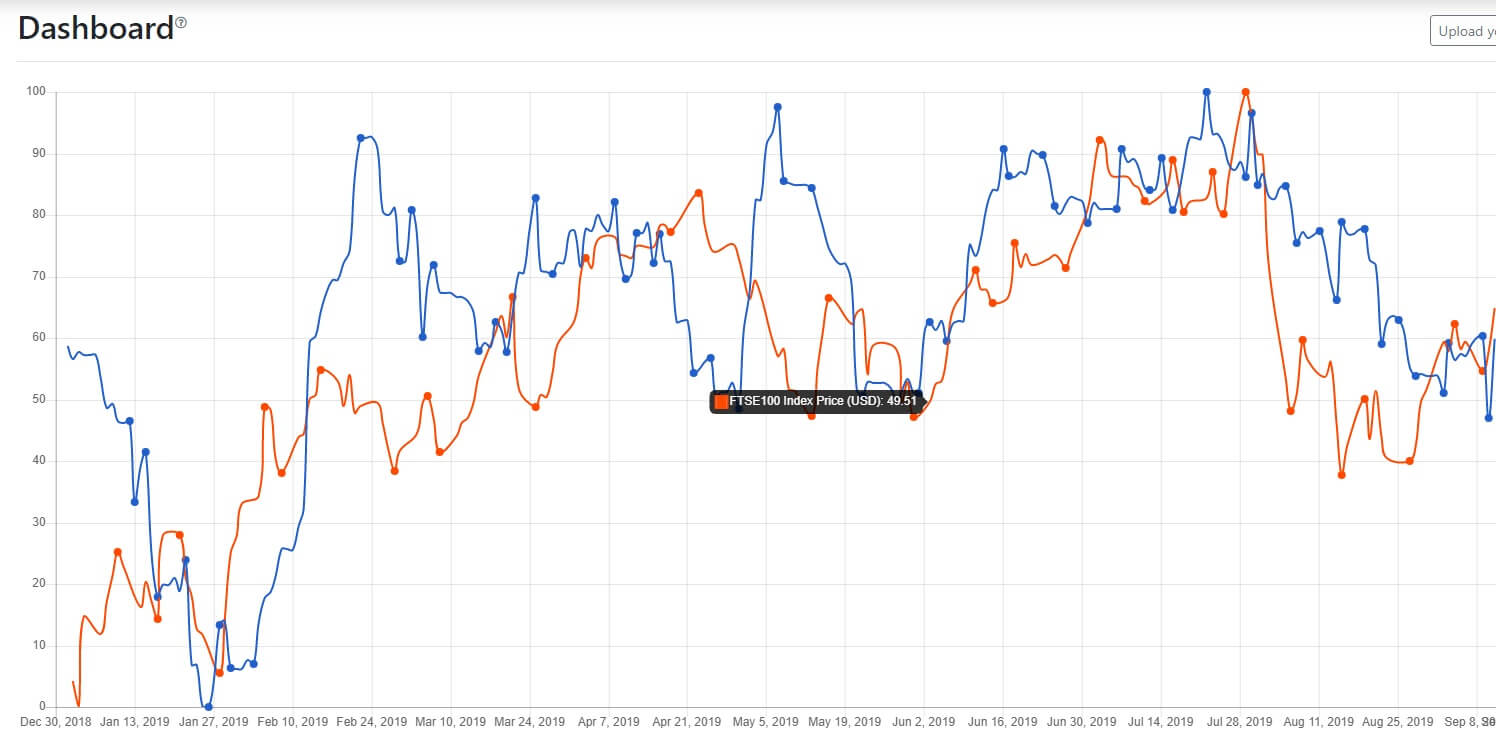 TimeNet Trend Correlation Analysis for FTSE 100 Index Price (USD) and approval rating of President Trump from Jan 2019 to September 11, 2019 (53.07%)
By checking TimeNet.cloud, Wikipedia and Google searches for some related keywords you’ll likely find other interesting discoveries.
SUMMARY
The answer to our title question, “Is Trump good for the stock market or are the stocks good for Trump?”, remains uncertain . We couldn’t find common driving forces behind the two time series, but some positive influence is undeniable between the stock market indices (especially FTSE 100) and Trump’s approval/disapproval rating.
Our world is of course infinitely complex and there’s no doubt many other factors are influencing stocks, and Trump’s approval rating which aren’t on the charts.
What other factors do you think play a role in influencing stocks? Get in touch with the Dyntell team to dive deeper into data correlation: info@dyntellbi.com.
As Bloomberg noted last year — and we here at Dyntell agree — it’s altogether possible that relationships found in these time series are completely coincidental.


