Prediction

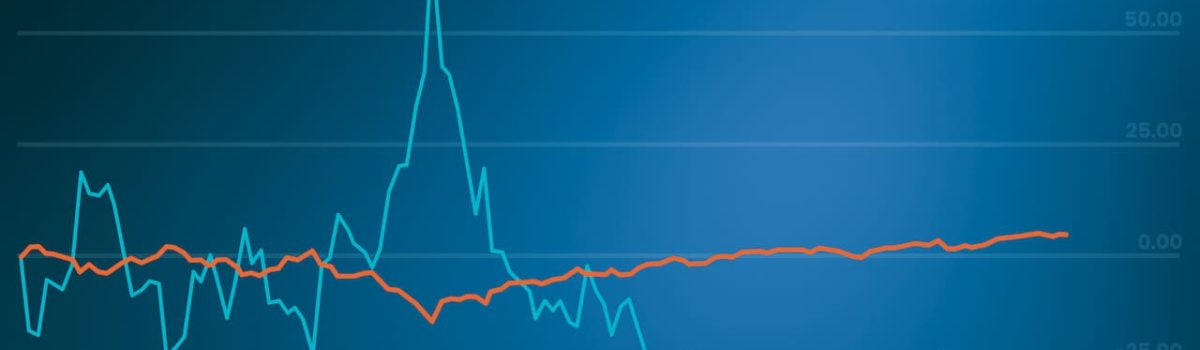
Analyzing the Fear Index

The fear index is something that you might have heard before; it’s a phrase widely used between stock market investors and traders as a general term to describe volatility in stocks. ‘Fear Index’, also sometimes referred to as the ‘fear gauge’, refers to the CBOE ‘Volatility Index’ – or the VIX. The VIX is used to measure the expected volatility on the stock market. It makes use of S&P 500 index options to calculate, to an extent, any predicted variance (or volatility) for the following 30 days. How Stock Prices Correlate with Market Volatility It’s hard to say for certain whether the Fear Index is an accurate way to measure or predict future realized volatility, as there are always outside contributions that may affect the…

Is Trump good for the stock market or are the stocks good for Trump?

Correlation

Is Trump good for the stock market or are the stocks good for Trump?

A little over 17 months ago Bloomberg analyzed the correlation between the S&P 500 and President Trump’s approval rating. And the article’s key takeaway wasn’t exactly positive. From July 2018 to April 2018, there was a clear negative correlation between stocks and the daily running approval ratings from Rasmussen Reports. Bloomberg writer Brandon Kochkodin’s conclusion: “Trump’s rhetoric is riling up his base while also scaring the markets”.   Dyntell’s data scientists were curious about how this trend has changed since, and we found something quite interesting starting early 2019 based on FiveThirtyEight statistics.  We used TimeNet.cloud to find a correlation and the charts below show results from January 2019 to August 2019. Correlation between S&P 500 Index Price (USD) and approval rating of President Trump…