Comparison: perceived vs. true spread of COVID-19

Correlation

Comparison: Perceived vs. True Spread of COVID-19

Here at Dyntell, we’re building a large time series database with the primary aim of benefitting society through access to data. In this post, we’ll study different time series representing both the true and the perceived spread of the coronavirus (COVID-19) pandemic. Daily COVID-19 numbers are currently available on TimeNet.cloud for many countries. We’re expanding these datasets with further variables measuring how we (people) perceive the significance of the pandemic. We use stock market movements and internet search trends to quantify the virus’s perceived spread.   Data Science and its role in fighting COVID-19 The current crisis is a great challenge for humanity—there is no arguing this. Since no vaccine is available and the incubation period can last as long as two weeks, it’s difficult…

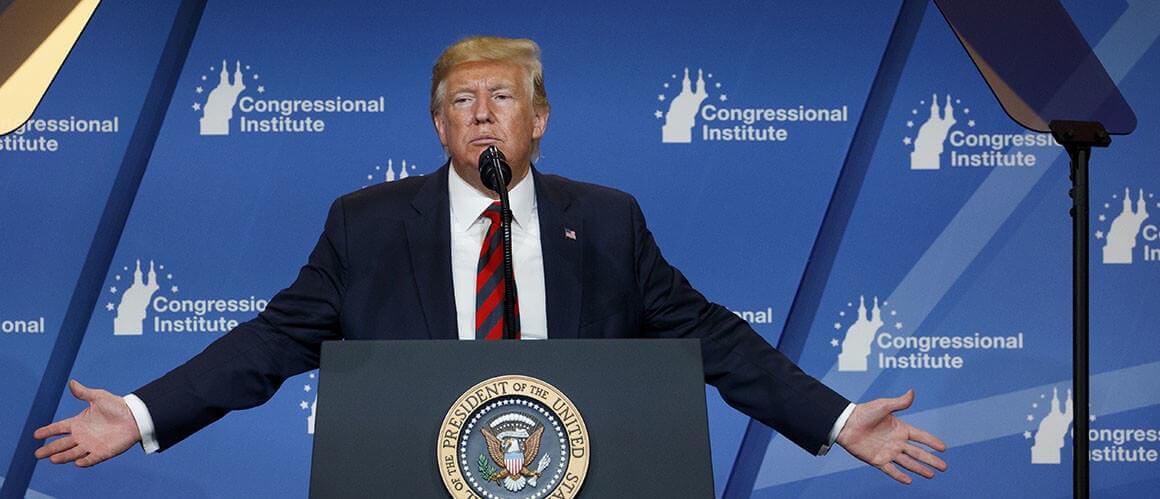
Is Trump good for the stock market or are the stocks good for Trump?

Correlation

Is Trump good for the stock market or are the stocks good for Trump?

A little over 17 months ago Bloomberg analyzed the correlation between the S&P 500 and President Trump’s approval rating. And the article’s key takeaway wasn’t exactly positive. From July 2018 to April 2018, there was a clear negative correlation between stocks and the daily running approval ratings from Rasmussen Reports. Bloomberg writer Brandon Kochkodin’s conclusion: “Trump’s rhetoric is riling up his base while also scaring the markets”.   Dyntell’s data scientists were curious about how this trend has changed since, and we found something quite interesting starting early 2019 based on FiveThirtyEight statistics.  We used TimeNet.cloud to find a correlation and the charts below show results from January 2019 to August 2019. Correlation between S&P 500 Index Price (USD) and approval rating of President Trump…