VISUALIZATION
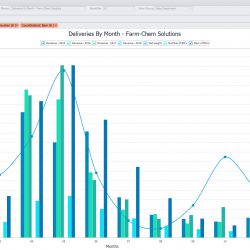
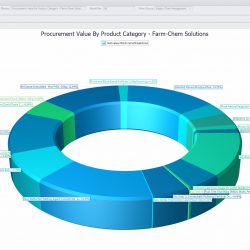
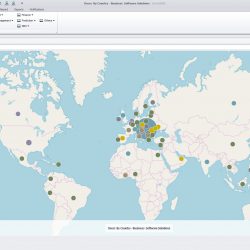
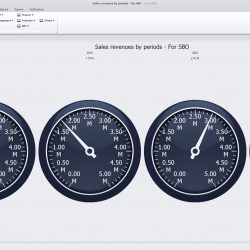
Get ready to see your data like you’ve never seen it before–as colorful charts that respond to your touch.
OUR VISUALIZATIONS LET YOU:
- Link to your own data sources or tap other resources
- Choose the format from every form imaginable to best express your insights
- Play with colors, backgrounds, legends and other visuals to create stunning images
- Design graphics that tell a story
- Share powerful charts and dashboards with your colleagues
- Prepare to analyze
Create Whatever You Want To ``See:``


